You are browsing the Hong Kong website, Regulated by Hong Kong SFC (CE number: BJA907). Investment is risky and you must be cautious when entering the market.
8月销售环比持平,9月市场有望企稳回升
格隆汇 09-01 10:12

作者:丁祖昱 

来源: 丁祖昱评楼市  

01

百强房企8月业绩表现趋稳,环比基本持平

2019年以来,中国房地产市场保持稳定增长预期。

按照可比口径统计,1-8月TOP100规模房企的累计业绩同比增速在4%左右,行业整体规模增速较2018年显著放缓

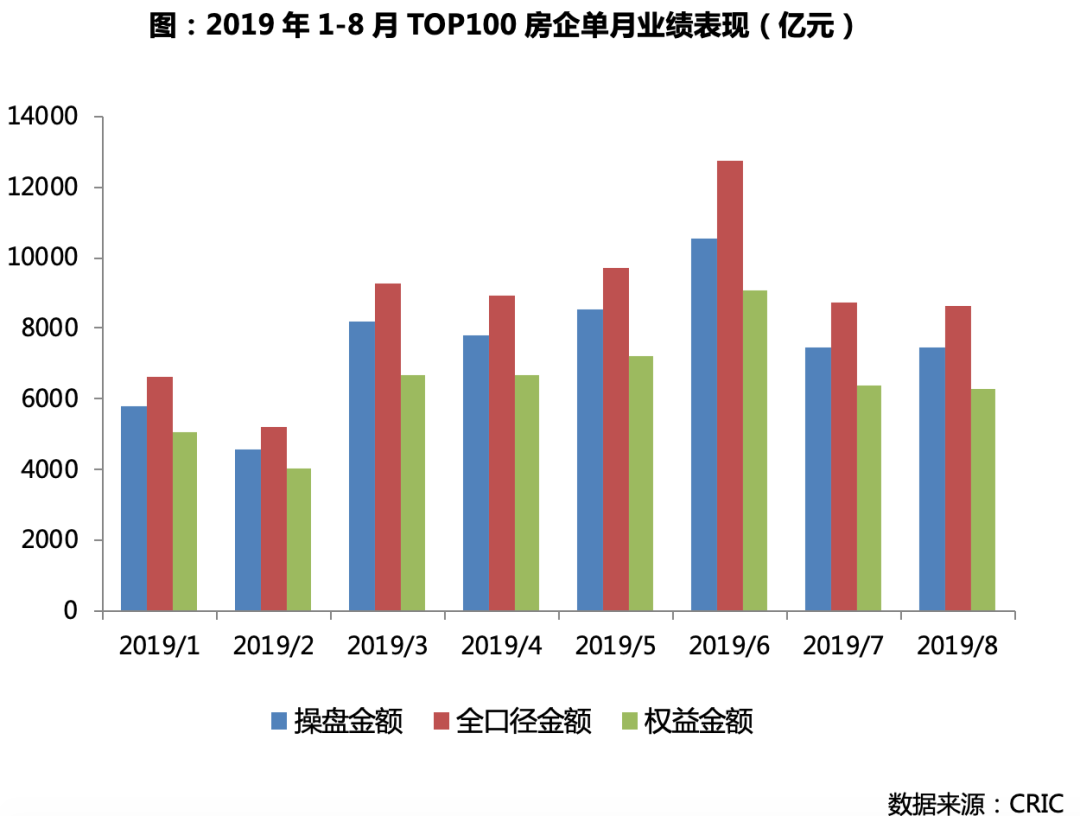
从单月业绩表现来看,2019年8月TOP100房企单月权益口径的销售规模合计近6300亿元,略低于1-7月6450亿元的均值。

相比7月近30%的环比降幅,百强房企8月单月权益口径的销售金额环比仅微降1.7%。

相比去年8月同比增长2%,单月业绩整体表现相对平稳。

02

TOP50房企单月环比增长1.6%,行业竞争格局加剧

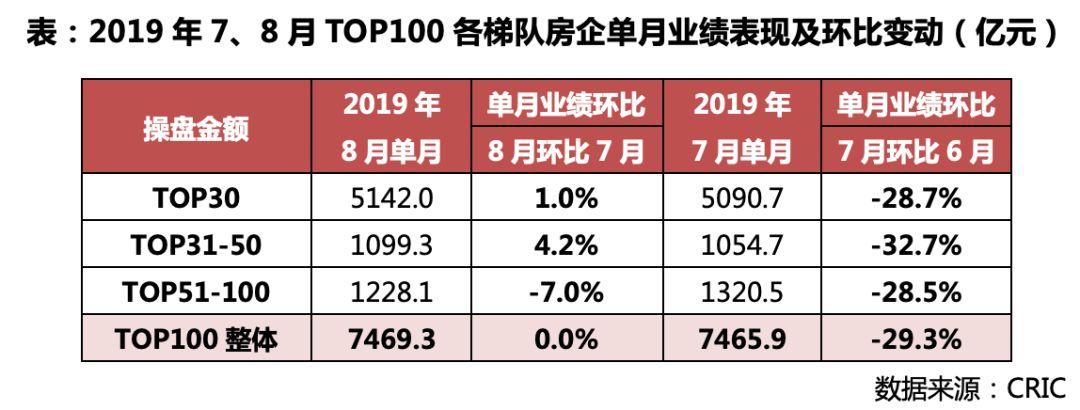
2019年8月,虽然百强房企整体的单月业绩规模较7月环比基本持平。

但从操盘口径来看,

TOP30和TOP31-50梯队房企8月单月的销售规模分别环比增长1%和4.2%。

相比之下,TOP51-100梯队房企8月单月的销售规模则环比下降了近7%。

随着行业竞争格局加剧,百强房企内部不同梯队房企8月单月的业绩表现出现一定程度的分化

03

超6成TOP30房企8月业绩环比上升,表现强于行业整体

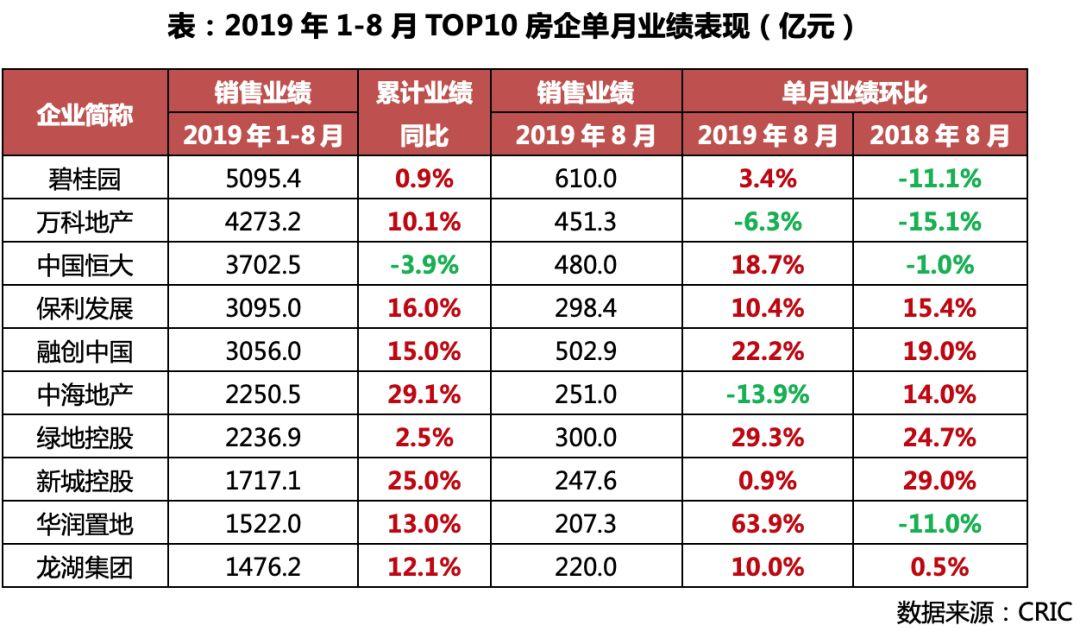
从企业业绩表现来看,TOP30房企中多数房企8月业绩环比上升。其中,

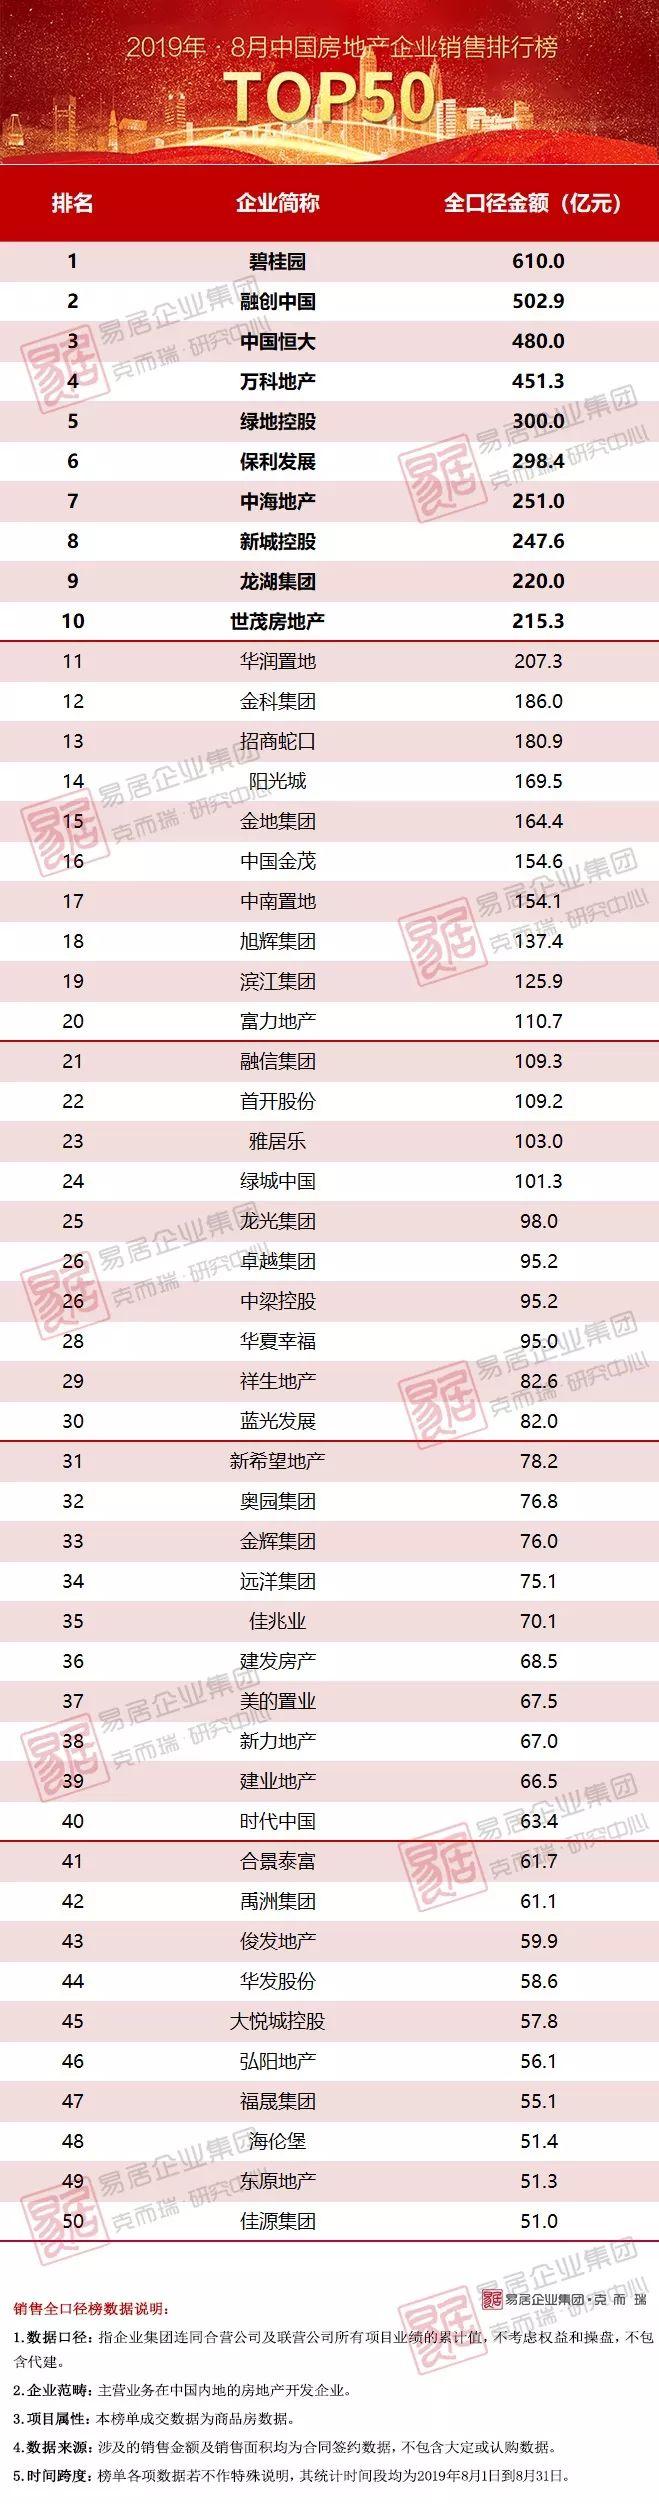
融创8月单月实现销售金额502.9亿元,环比增长22.2%。

华润置地和龙湖8月单月实现销售金额207.3亿元和220亿元,分别环比增长63.9%和10%。

TOP3房企中,

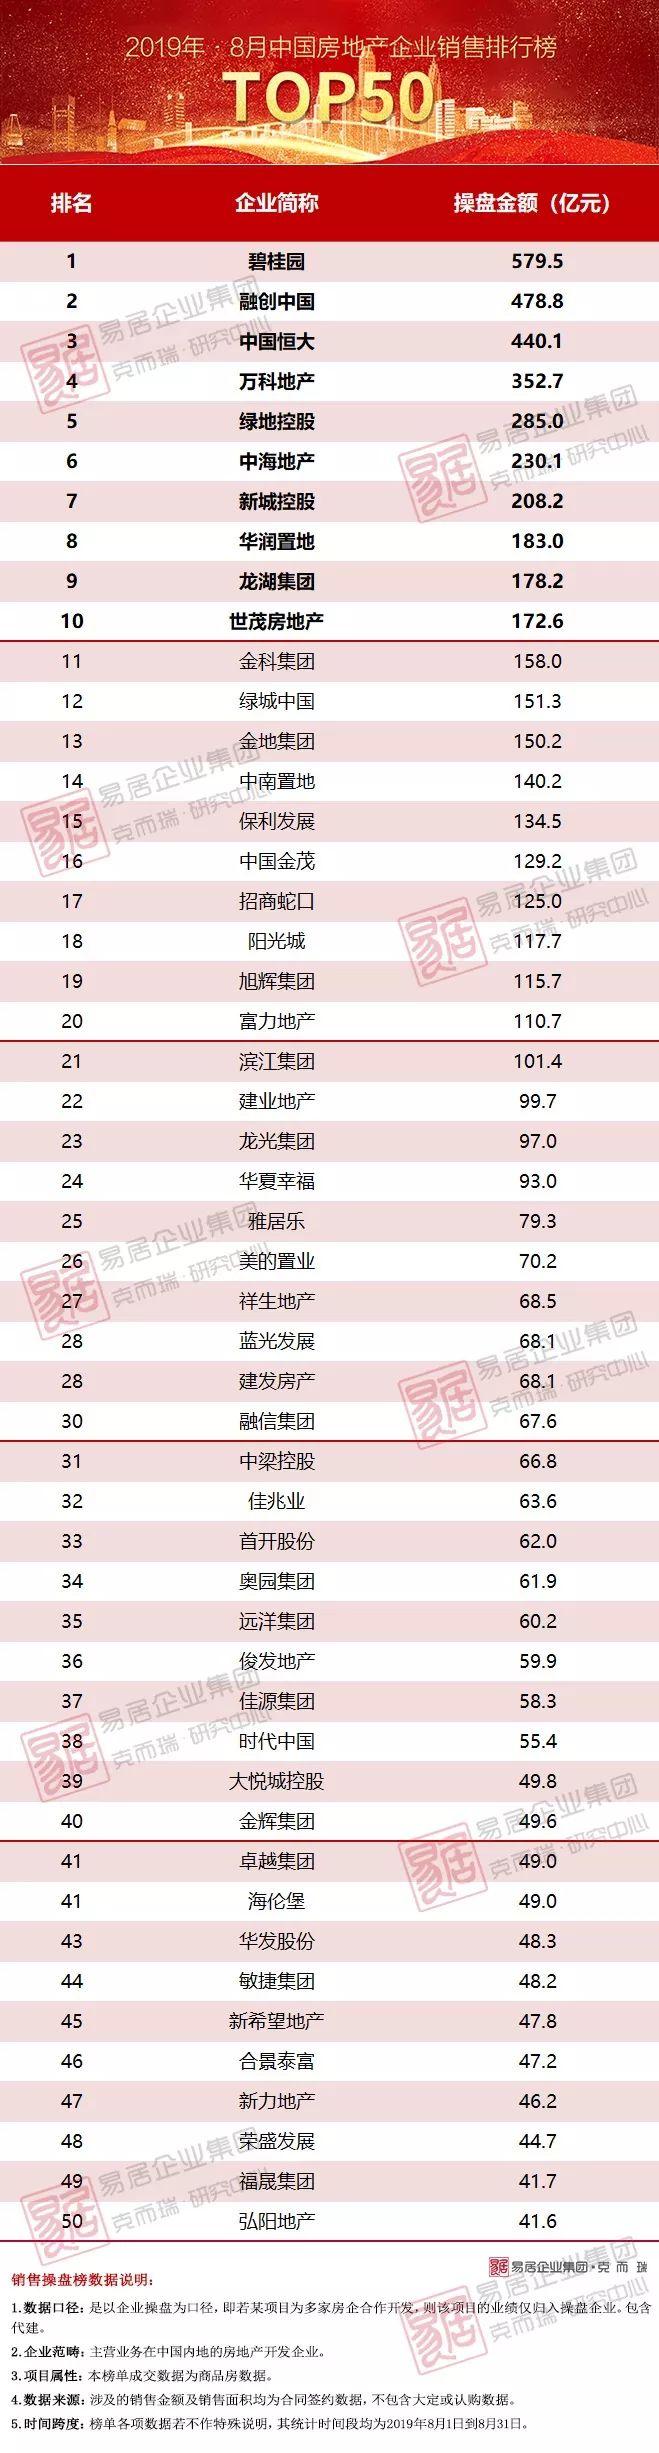
碧桂园8月单月实现全口径业绩规模610亿元,累计金额5095.4亿元,在操盘、全口径、权益三大榜单中继续位居行业榜首的位置

恒大8月单月实现全口径销售金额480亿元,较7月环比增长18.7%。

同时,8月在TOP30房企中也有11家房企单月业绩环比下降。

其中,万科8月单月实现销售金额451.3亿元,环比降低了6.3%,但相比去年同期降幅收窄。

旭辉和招商蛇口8月单月则实现销售金额137.4亿元和180.9亿元,分别环比下降5.6%和6.4%。

04

百强房企中部分企业8月单月业绩表现较为突出

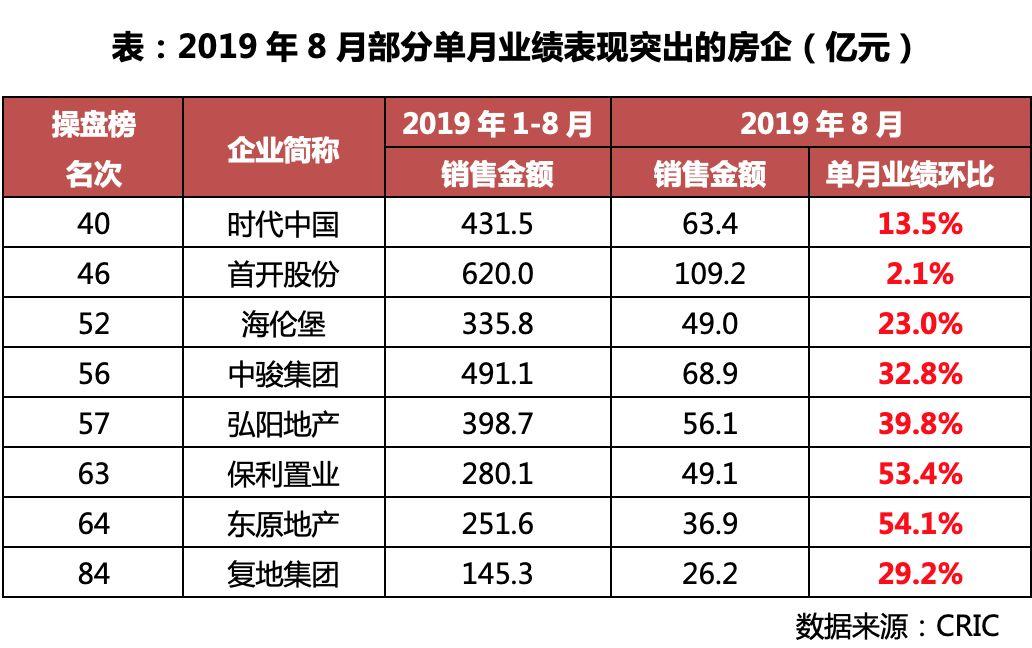
TOP31-50梯队房企中,建业、时代、首开、俊发等企业8月单月业绩表现较为突出。其中,

时代中国受益于广州、佛山、江门、东莞等粤港澳大湾区城市的项目业绩贡献,8月单月实现销售金额63.4亿元,业绩环比增长13.5%。

俊发得益于在昆明市场的深耕,8月单月销售金额59.9亿元,1-8月累计业绩销售达到357亿元。

而在TOP51-100房企中,海伦堡、中骏、弘阳、保利置业、东原、复地等企业8月业绩环比较高。其中,

中骏在天津、南京、泉州、漳州等城市的项目业绩贡献较高,8月单月实现销售金额68.9亿元,累计业绩达到491.1亿元。

弘阳1-8月累计实现销售金额398.7亿元,单月业绩56.1亿元,环比增长近40%。8月,其重庆时光澜庭、仪征悦江湾、湖州仁皇正弘府等项目业绩贡献较高。

05

8月市场持续转冷,9月或将出现变局

我认为,8月多数房企的销售业绩表现为环比增长,主要还是得益于企业加大了供货力度。项目实际的去化情况并不佳,市场不如企业销售表现的那么好。

从市场层面来看,8月重点监测城市累计成交量持续走低,房地产市场持续转冷。

从供应层面来看,与去年同期相比目前房企仍面临较大的供货压力。但预计随着传统“金九银十”销售旺季的到来,9月份供应量有望得到明显改善。

9月特别是第四季度之后房企也势必进一步加大推案及营销力度,市场整体成交量有望企稳回升。

【附榜单】

Follow us
Find us on Facebook, Twitter , Instagram, and YouTube or frequent updates on all things investing.Have a financial topic you would like to discuss? Head over to the uSMART Community to share your thoughts and insights about the market! Click the picture below to download and explore uSMART app!
Disclaimers
uSmart Securities Limited (“uSmart”) is based on its internal research and public third party information in preparation of this article. Although uSmart uses its best endeavours to ensure the content of this article is accurate, uSmart does not guarantee the accuracy, timeliness or completeness of the information of this article and is not responsible for any views/opinions/comments in this article. Opinions, forecasts and estimations reflect uSmart’s assessment as of the date of this article and are subject to change. uSmart has no obligation to notify you or anyone of any such changes. You must make independent analysis and judgment on any matters involved in this article. uSmart and any directors, officers, employees or agents of uSmart will not be liable for any loss or damage suffered by any person in reliance on any representation or omission in the content of this article. The content of the article is for reference only and does not constitute any offer, solicitation, recommendation, opinion or guarantee of any securities, virtual assets, financial products or instruments. Regulatory authorities may restrict the trading of virtual asset-related ETFs to only investors who meet specified requirements. Any calculations or images in the article are for illustrative purposes only.
Investment involves risks and the value and income from securities may rise or fall. Past performance is not indicative of future performance. Please carefully consider your personal risk tolerance, and consult independent professional advice if necessary.
uSMART
Wealth Growth Made Easy
Open Account