


Following the release of recent PMI data in the United States, all three major stock indices experienced their largest declines since August 5. Specifically, the Dow Jones Industrial Average fell by over 620 points, dropping below 40,000; the Nasdaq Composite declined by more than 3%; and the VIX index surged above 40 at one point.
PMI Data Interpretation
The Purchasing Managers' Index (PMI) serves as a critical economic indicator for assessing manufacturing activity, with a reading of 50 delineating economic expansion from contraction. A PMI value above 50 signifies expansion, whereas a value below 50 indicates contraction. Consequently, the latest PMI data from the U.S. have heightened market apprehensions regarding economic conditions.
ISM Manufacturing PMI: Recent data show that the ISM Manufacturing PMI’s new orders index stands at 44.6, which is the lowest level since June 2023, down from 47.4 in July. This marks the fifth consecutive month that the PMI has remained below the neutral 50 threshold, thereby signifying ongoing contraction in manufacturing activity.
Markit Manufacturing PMI: Conversely, the final August reading of the Markit Manufacturing PMI is 47.9, which is slightly above the ISM data but still below expectations. This figure represents the lowest level recorded this year, further corroborating the trend of weakening in the manufacturing sector.
PMI Data Indicates Recession and Stagflation
The convergence of the two PMI indices conveys three significant signals:
- Decline in New Orders/Inventory Ratio: First, the decrease in the new orders/inventory ratio to recessionary levels indicates severe issues within the manufacturing sector and mounting pressures from economic deceleration. This potentially leads to further declines in production and demand.
- Revival in Manufacturers' Price Index: Second, the resurgence of the manufacturers' price index suggests that the easing of commodity inflation might be concluding. This observation could imply that we have reached the trough of the current Consumer Price Index (CPI) cycle.
- Improvement in Employment Index: Finally, the notable improvement in the employment index compared to July suggests that the forthcoming non-farm payroll report may exceed expectations.
(Source:Wall Street Journal)
Market Response
In response to the PMI data release, U.S. stock indices recorded their largest single-day declines since August 5. Specifically, the S&P 500 fell by 2.4%, the Nasdaq Composite dropped by over 3%, marking its third-largest single-day decline in the past year, and the Dow Jones retreated below 41,000.
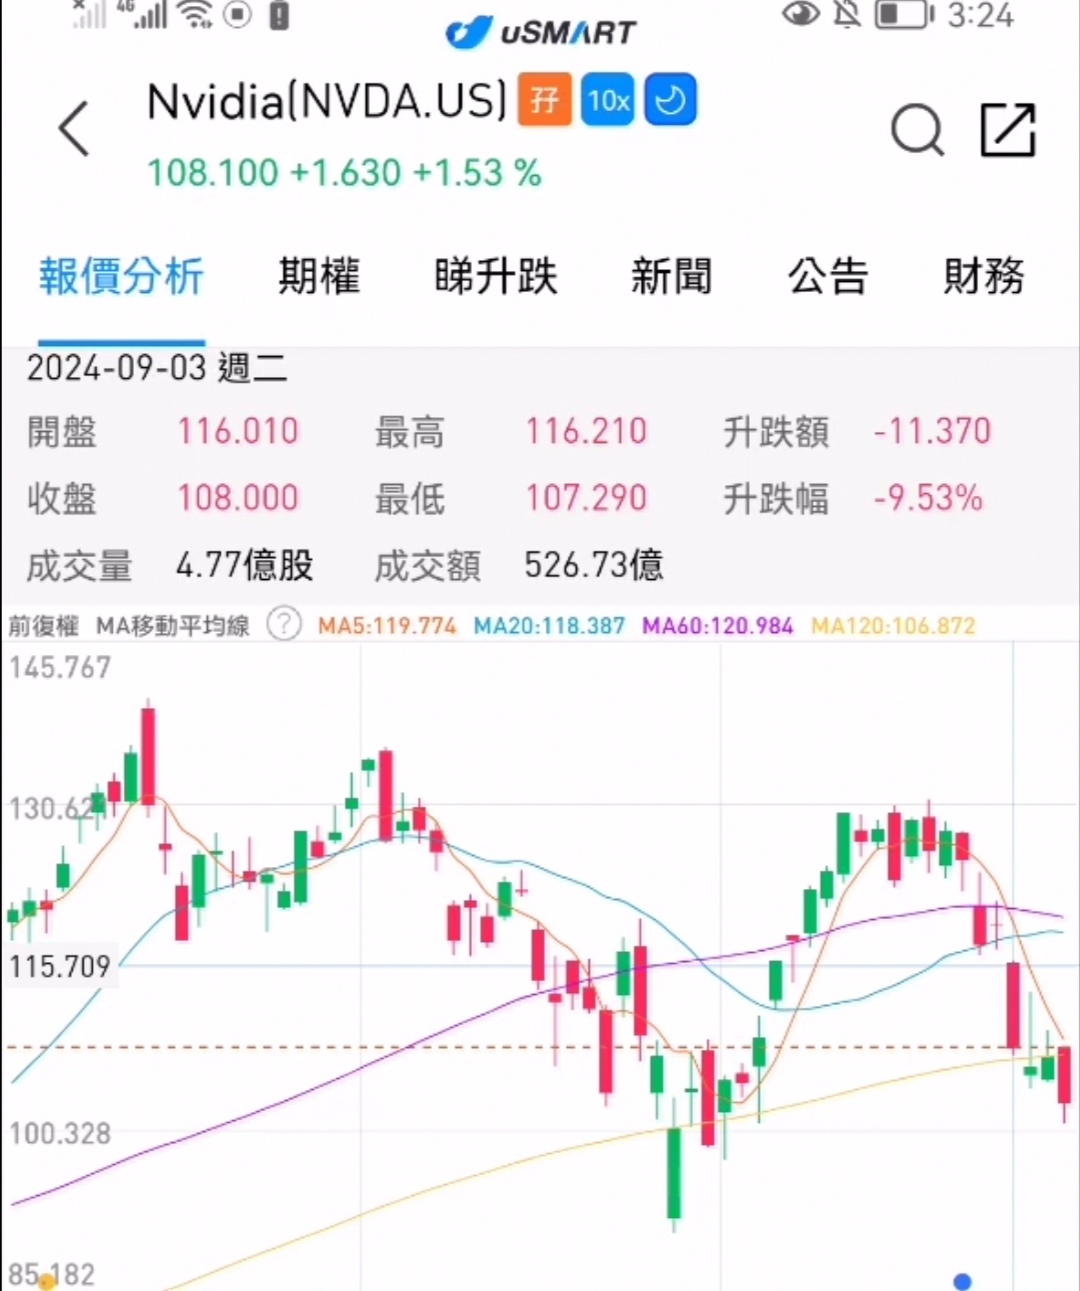
The technology sector was particularly affected, with semiconductor stocks experiencing substantial losses. For instance, Nvidia fell by 9.53% to a three-week low, erasing $278.9 billion in market value, which surpassed the previous record of $251 billion set by Meta in February 2022. Meanwhile, Tesla, after an initial increase of 2.7%, ended the day down 1.64%, despite an increase in August deliveries in China. Additionally, Amazon declined by 1.26%, Google (Alphabet A) fell by 3.68%, Apple dropped by 2.72%, Microsoft decreased by 1.85%, and Meta Platforms (formerly Facebook) saw a decline of 1.83%.
(Source:uSMART HK)
Furthermore, sector-specific ETFs also closed broadly lower. The semiconductor ETF plummeted by 7.5%, while global technology and technology sector ETFs each fell by nearly 5%. The energy and cybersecurity sector ETFs declined by over 2%, and the biotechnology, global airlines, consumer discretionary, banking, and regional banks ETFs all fell by at least 1%. In contrast, the consumer staples ETF increased by 0.7%.
(Source:Wall Street Journal)
Finally, U.S. Treasury yields experienced a slight decline, with the 10-year Treasury yield falling by 6.5 basis points to 3.846%.


More Content


