You are browsing the Hong Kong website, Regulated by Hong Kong SFC (CE number: BJA907). Investment is risky and you must be cautious when entering the market.
港股:三年一遇的指數機會
格隆匯 10-06 14:07

本文來自格隆匯專欄作家: 奔波兒霸研究室

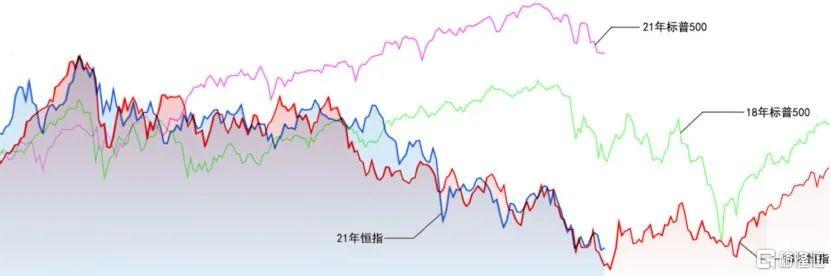
紅色線是18年的恆生指數,綠色線是18年的標普500,藍色線是21年的恆生指數,紫色線是21年的標普500。

今年的恆生指數走勢與18年非常類似,先是一波非理性衝頂,然後有三波回落。

第一波回落是衝頂後的情緒平復,隨後震盪幾個月。

第二波回落是經濟基本面下滑導致的,大體來説都是滯漲,具體又有區別,18年是去槓桿、中小製造業危急,今年是地產下行、監管政策導致很多行業萎靡。

第三波回落是美股見頂下行導致的,美國經濟週期滯後於中國半年。根據18年經驗,美股下行有兩個階段,第一階段下行會導致港股見底,第二階段下行對港股壓制力弱化,並沒有導致港股創新低。

18年恆生指數從頂部到底部,下跌26.7%;今年恆生指數從頂部到目前,下跌23.5%,跌幅已經非常接近。

從上邊那個圖來看,從指數跌幅來看,港股已經非常接近底部,只需再磨底幾個月,待美股徹底跌到位,港股就將迎來反攻。

把視角放在更長的週期,來探究A股和港股的強弱關係。

11年10月到14年7月,恆指漲28%,滬深300跌16%,港股強於A股,持續33個月。

14年7月到15年6月,恆指漲16%,滬深300漲147%,港股弱於A股,持續11個月。

15年6月到18年12月,恆指跌6%,滬深300跌44%,港股強於A股,持續42個月。

19年1月到20年10月,恆指跌5%,滬深300漲64%,港股弱於A股,持續34個月。

A股和港股每隔幾年來一次強弱切換,除了14年7月到15年6月的A股大牛市,其餘階段大概都持續三年左右。

這一輪從19年初到現在,港股弱於A股的行情已經持續34個月,在這個港股的底部區域,很可能發生強弱切換。

很多人對今年的熊市感受不深,這是因為18年A股弱於港股,今年A股強於港股,大部分人以A股為主,沒太感受到港股目前的蕭瑟。

未來兩年,港股大概率會顯著跑贏A股,甚至成為全球表現最好的指數,走出類似16年2月到18年2月的牛市行情。

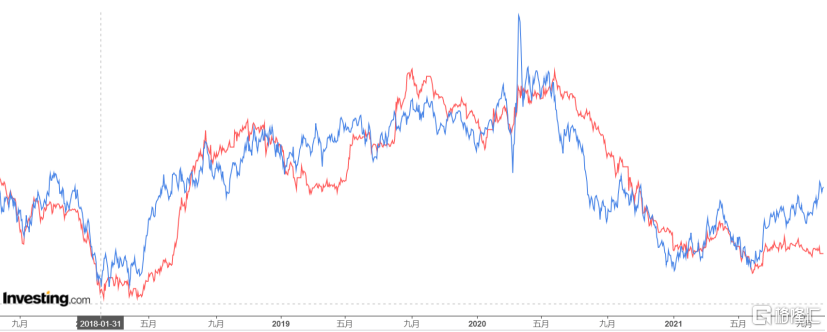
藍色線是美元指數,紅色線是美元人民幣匯率。

18年1月,美元指數和人民幣匯率同步見底,恆生指數和滬深300同步見頂,股市與匯率同步。

今年5月,美元指數見底回升,走勢類似於18年,人民幣匯率卻在底部震盪,並沒有跟隨美元。這是因為中國出口一直不錯,匯率體現了中國經濟對外的強勢。

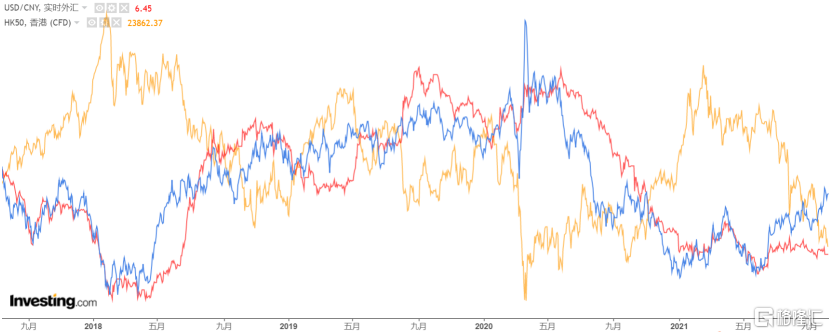
把恆指放到這張圖裏,藍色是美元指數,紅色是人民幣匯率,黃色是恆生指數。

從過往情況來看,恆生指數與人民幣匯率、美元指數是匹配度非常高的反向關係。

不過有時候與人民幣匯率的匹配度更高,比如整個19年,這個階段投資者更看重中國經濟基本面。

有時候與美元指數的匹配度更高,比如20年3月,這個階段投資者更看重國際流動性。

最近幾個月,恆指明顯跟人民幣匯率脱離,完全跟隨美元指數的走勢,投資者更看重國際宏觀-美元流動性的影響,暫時忽略了中國基本面-人民幣匯率的影響。

這應該不會持續很久,等美元指數見頂穩定後,投資者大概率會把關注度轉向中國經濟基本面,港股估值有望迎來糾偏。

最後總結一下:

經過三波下跌,港股本輪熊市已經接近底部區域。

過去幾年港股表現全球最差,人民幣匯率卻非常強勢,這兩者之間有極大的矛盾。

待美股跌到位、美元指數見頂之後,港股大概率將迎來一輪猛烈的牛市。

16年2月的港股-19年1月的A股-當下的港股,這是中國資本市場三年一遇的機會。過了這個缺電的冬天,明年將形勢一片大好。

Follow us
Find us on Facebook, Twitter , Instagram, and YouTube or frequent updates on all things investing.Have a financial topic you would like to discuss? Head over to the uSMART Community to share your thoughts and insights about the market! Click the picture below to download and explore uSMART app!
Disclaimers
uSmart Securities Limited (“uSmart”) is based on its internal research and public third party information in preparation of this article. Although uSmart uses its best endeavours to ensure the content of this article is accurate, uSmart does not guarantee the accuracy, timeliness or completeness of the information of this article and is not responsible for any views/opinions/comments in this article. Opinions, forecasts and estimations reflect uSmart’s assessment as of the date of this article and are subject to change. uSmart has no obligation to notify you or anyone of any such changes. You must make independent analysis and judgment on any matters involved in this article. uSmart and any directors, officers, employees or agents of uSmart will not be liable for any loss or damage suffered by any person in reliance on any representation or omission in the content of this article. The content of the article is for reference only and does not constitute any offer, solicitation, recommendation, opinion or guarantee of any securities, virtual assets, financial products or instruments. Regulatory authorities may restrict the trading of virtual asset-related ETFs to only investors who meet specified requirements. Any calculations or images in the article are for illustrative purposes only.
Investment involves risks and the value and income from securities may rise or fall. Past performance is not indicative of future performance. Please carefully consider your personal risk tolerance, and consult independent professional advice if necessary.
uSMART
Wealth Growth Made Easy
Open Account