華勤技術回覆科創板問詢:營收超百億,毛利率不足10%
近日,華勤技術股份有限公司(簡稱“華勤技術”)已進入問詢階段,計劃在科創板掛牌上市。本次IPO擬募資金75億元,中金公司為獨家保薦人。
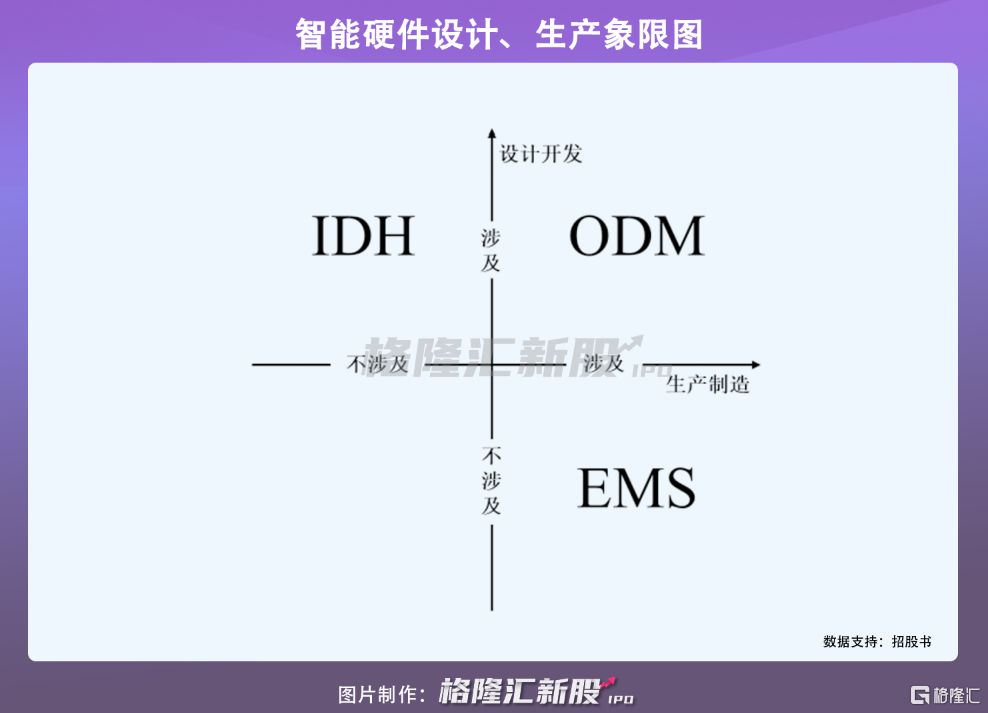
華勤技術成立於2005年,是一家專業從事智能硬件產品的研發設計、生產製造和運營服務的平台型公司,屬於智能硬件ODM行業。
公司產品有智能手機、筆記本電腦、平板電腦、智能穿戴(包含智能手錶、TWS耳機、智能手環等)、AIoT產品(包含智能POS機、汽車電子、智能音箱等)及服務器等智能硬件產品,主要客户包括三星、OPPO、小米、vivo、亞馬遜等。
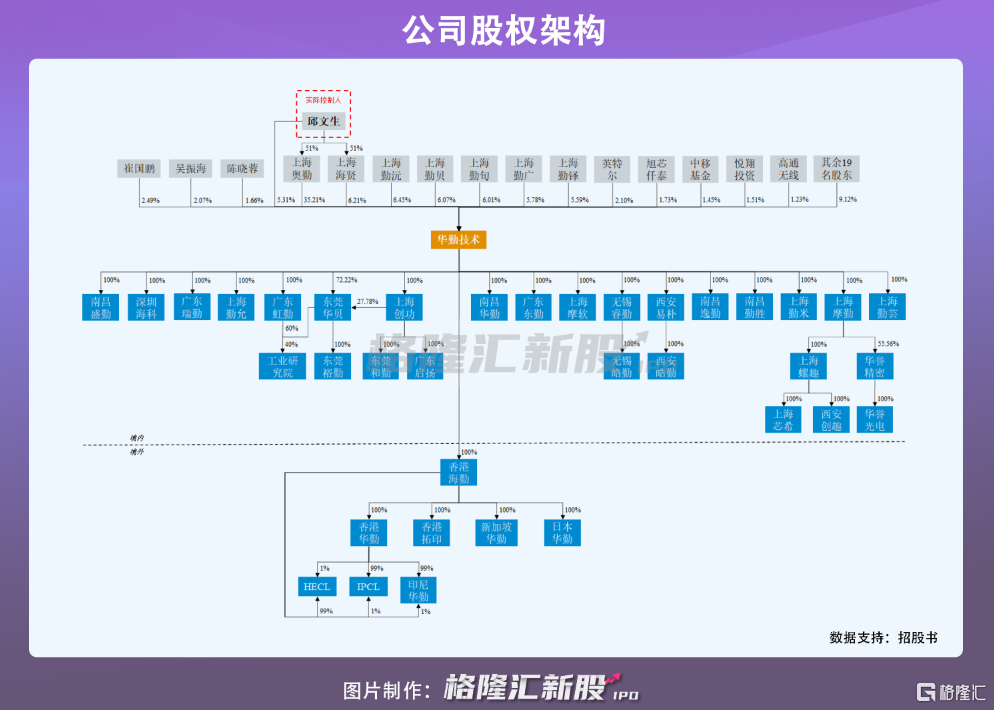
招股書顯示,上海奧勤持有公司35.21%的股份,為公司控股股東,邱文生直接持有公司5.31%的股份,並通過上海奧勤、上海海賢間接控制公司41.42%的股份,合計46.73%的股份,是公司的實際控制人。值得注意的是,英特爾和高通無線均為股東,分別持有公司2.1%、1.23%的股份。
1
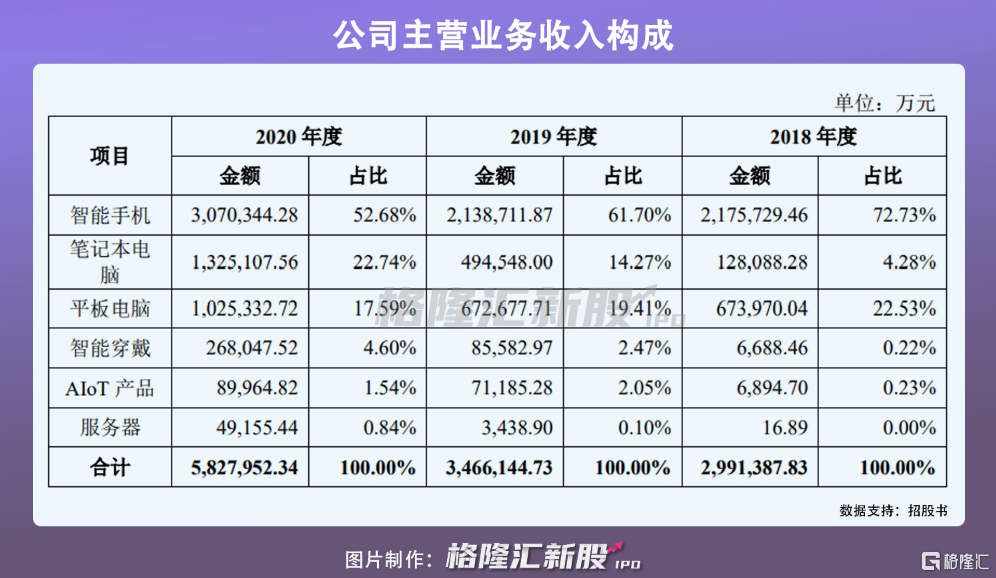
智能手機業務為主要收入來源
華勤技術所處的行業為智能硬件ODM行業,ODM模式即原始設計製造商模式,根據品牌廠商的需求,為其研發、設計及生產產品。
智能手機、筆記本電腦及平板電腦,俗稱“智能硬件三大件”,為全球最普及的智能硬件產品,是引領消費電子終端的主力軍,近年來每年出貨量保持在17億件左右。
當前,智能硬件三大件的滲透率是決定ODM行業市場規模的關鍵。
細分來看,2020年,36%的智能手機是由ODM/EMS廠商生產;88%的筆記本電腦是由ODM/EMS廠商生產;89%的平板電腦為ODM/EMS廠商生產。
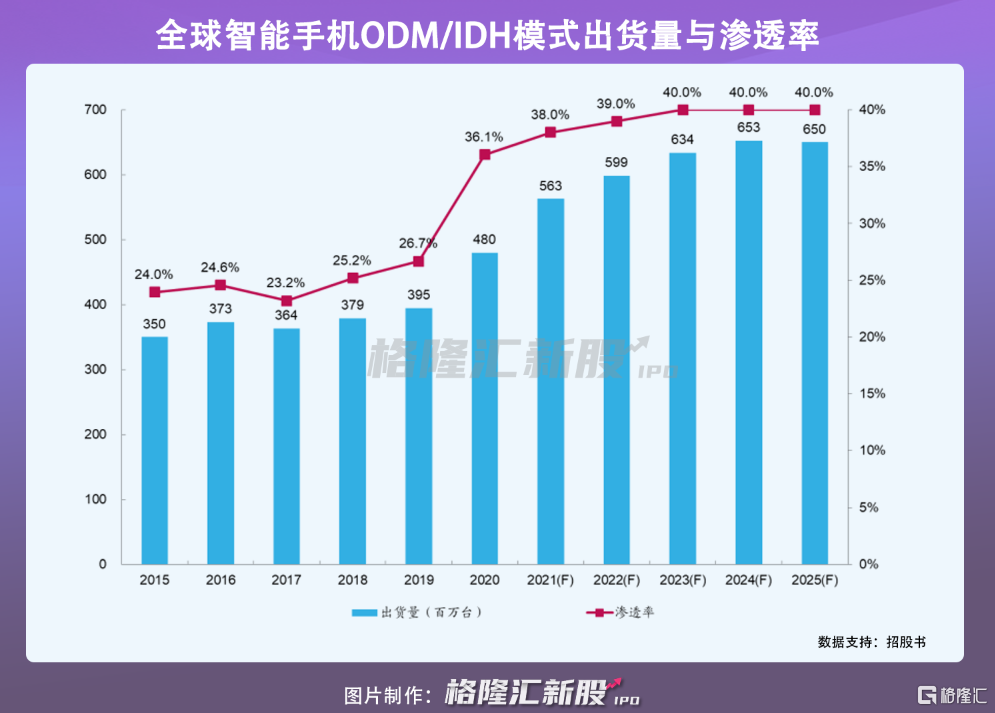
隨着全球消費電子逐漸從增量時代步入存量時代,兼具快速研發與精益製造的ODM廠商在專業化分工中不斷崛起,市場空間快速提升。
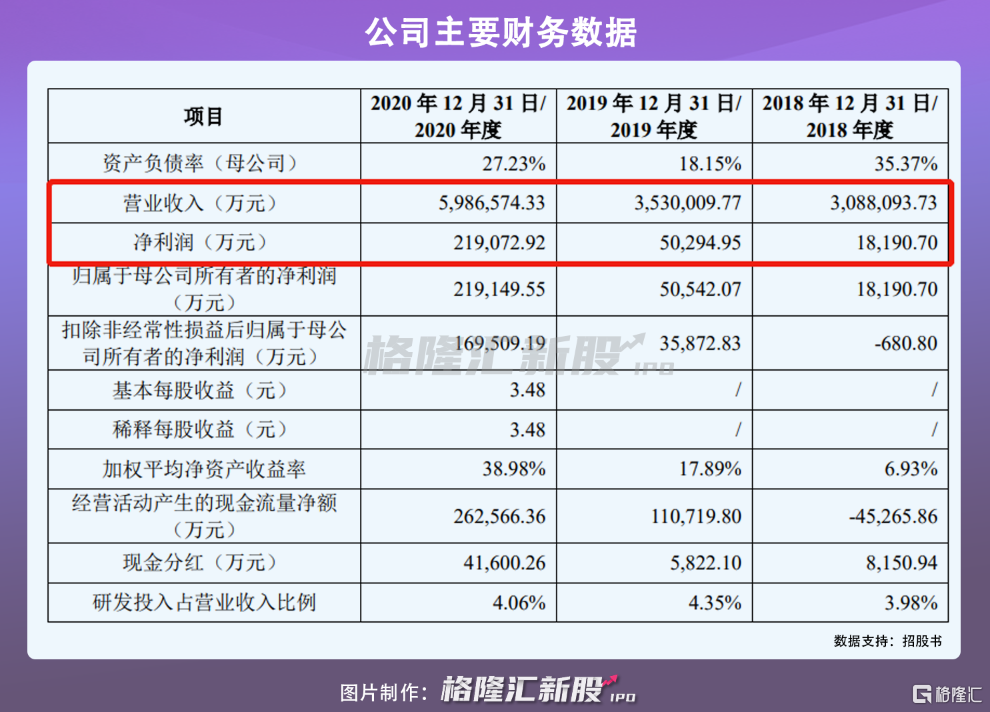
報吿期內,華勤技術錄得營收309億元、353億元和599億元,同期淨利潤為1.82億元、5.03億元和21.9億元。
其中,智能手機是公司的主要收入來源,2018年至2020年分別佔比營收72.73%、61.7%和52.68。雖然佔比逐年下降,但主要是由於筆記本電腦的比重逐年遞增,而當下市場更火熱的智能穿戴和AIot產品卻依舊佔比甚微。
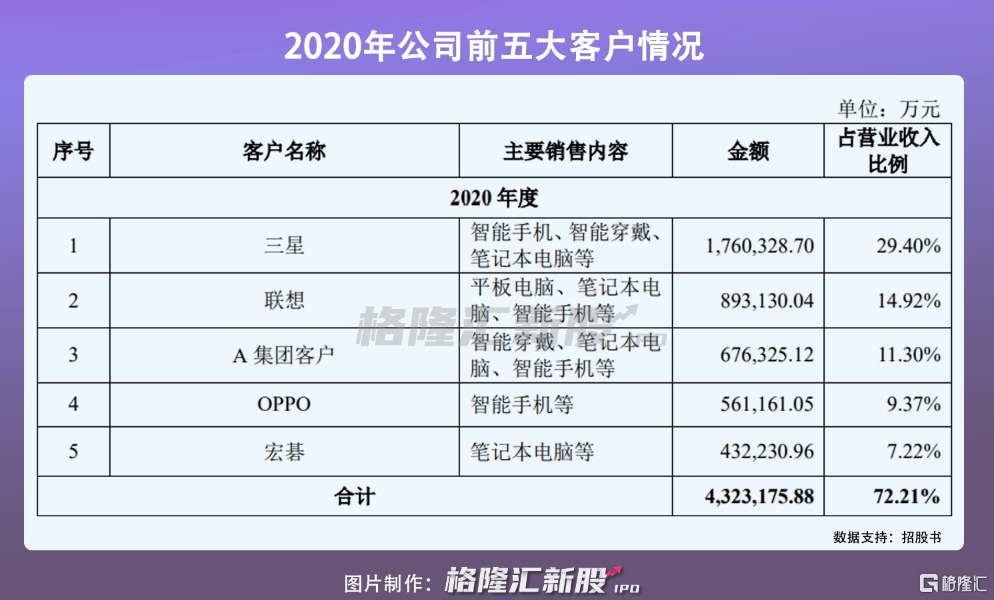
2018年至2020年,華勤技術前五大客户的銷售比例分別為88.23%、81.7%和72.21%,其中2020年前五大客户包括三星、聯想、OPPO等。由於下游全球智能硬件品牌廠商市場集中度較高,導致公司客户集中度較高。
2
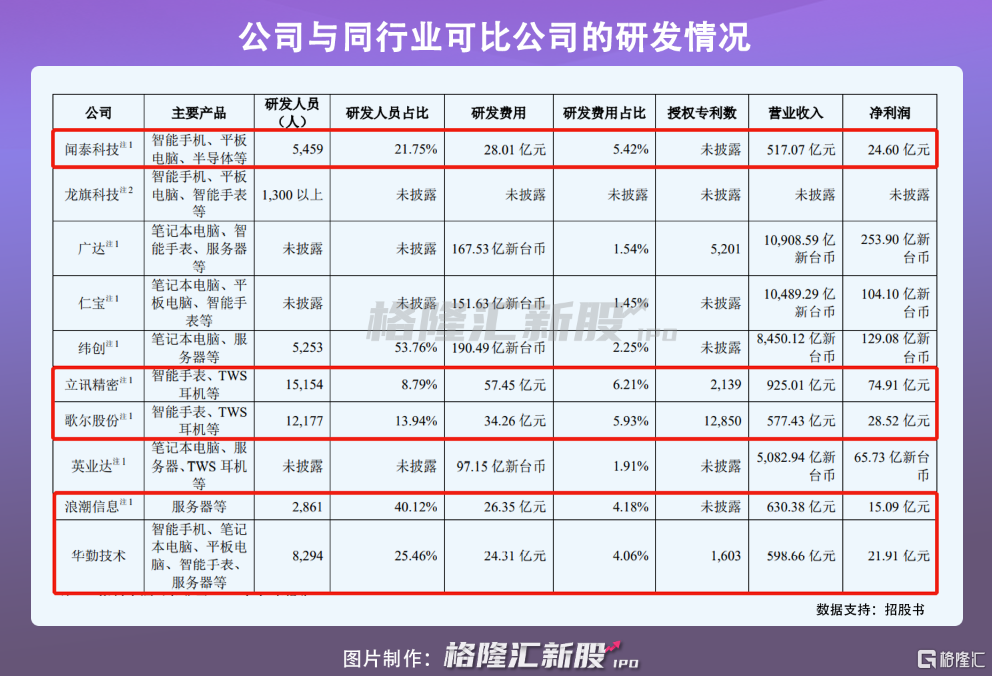
研發投入不及可比公司
基於部分客户所用原材料的保密性、專用性和供應及時性等因素,華勤技術採用Buy&Sell模式進行該原材料交易,即該部分客户根據公司研發設計的器件選型清單先行向原材料供應商採購後轉售給公司,公司自行購買其他原材料等並組織生產加工,生產完畢後再將產成品銷售給客户。
在公司客户集中度較高的情況下,如果客户未來提高Buy & Sell模式下的原材料供給比例、降低賬期等,將對公司毛利率造成不利影響。
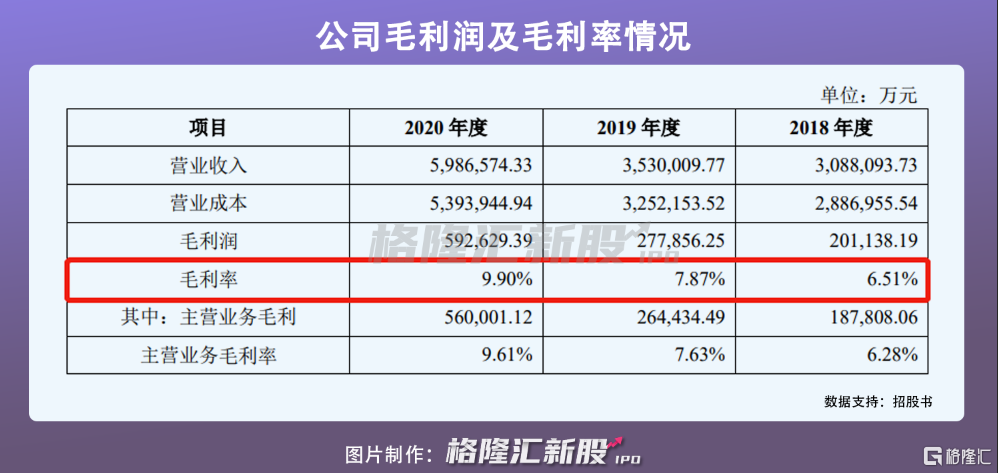
受此模式影響,疊加ODM行業整體毛利率較低的原因,雖然華勤技術營收規模已達百億規模,但綜合毛利率卻不足10%,報吿期內分別為6.51%、7.87%和9.9%,低於行業平均水平,倘若公司業務結構無法得到優化,毛利率將進一步受到擠壓,將給公司的財務和經營業績帶來不利。
此外,華勤技術在報吿期內研發投入為12.29億元、15.36億元、24.41億元,逐年遞增,分別佔比營收3.98%、4.35%、4.06%,佔比情況呈現一定波動,與此同時,相較上市可比公司而言,華勤技術的研發投入略顯遜色。
3
結語
隨着消費電子迭代升級,全球保持較為穩定的出貨量,ODM廠商仍存有景氣的增長空間,得益於此,華勤技術營收規模逐年遞增。不過,公司在經營模式上存在一定風險,導致綜合毛利率較低,盈利情況較不樂觀。
Follow us
Find us on
Facebook,
Twitter ,
Instagram, and
YouTube or frequent updates on all things investing.Have a financial topic you would like to discuss? Head over to the
uSMART Community to share your thoughts and insights about the market! Click the picture below to download and explore uSMART app!

Disclaimers
uSmart Securities Limited (“uSmart”) is based on its internal research and public third party information in preparation of this article. Although uSmart uses its best endeavours to ensure the content of this article is accurate, uSmart does not guarantee the accuracy, timeliness or completeness of the information of this article and is not responsible for any views/opinions/comments in this article. Opinions, forecasts and estimations reflect uSmart’s assessment as of the date of this article and are subject to change. uSmart has no obligation to notify you or anyone of any such changes. You must make independent analysis and judgment on any matters involved in this article. uSmart and any directors, officers, employees or agents of uSmart will not be liable for any loss or damage suffered by any person in reliance on any representation or omission in the content of this article. The content of the article is for reference only and does not constitute any offer, solicitation, recommendation, opinion or guarantee of any securities, virtual assets, financial products or instruments. Regulatory authorities may restrict the trading of virtual asset-related ETFs to only investors who meet specified requirements. Any calculations or images in the article are for illustrative purposes only.
Investment involves risks and the value and income from securities may rise or fall. Past performance is not indicative of future performance. Please carefully consider your personal risk tolerance, and consult independent professional advice if necessary.


