恒指季检公布:泡泡玛特等纳入港股通在即!赚钱效应几何?
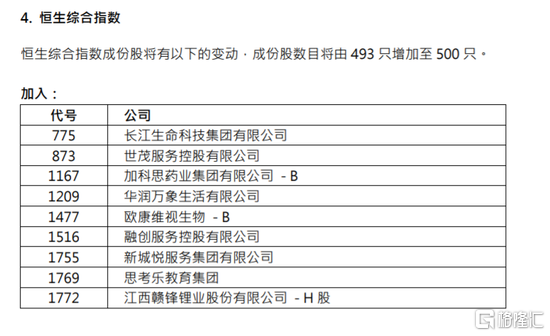
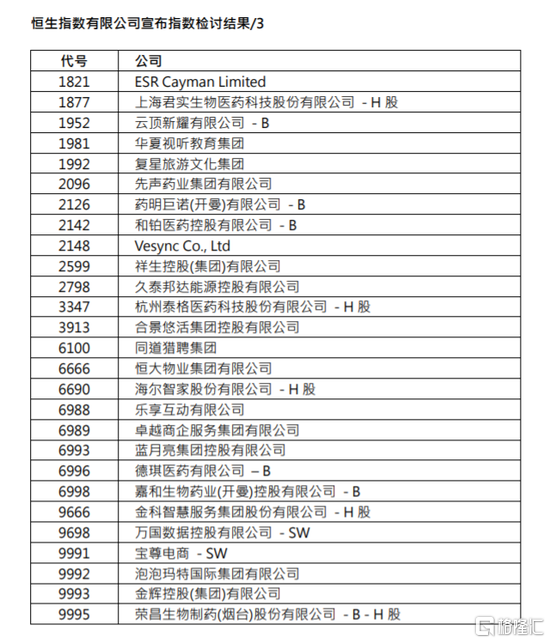
2月26日消息,恒生指数公司公布季度检讨结果,世茂服务、华润万象、融创服务、新城悦复星旅文、恒大物业、泡泡玛特、蓝月亮、海尔智家等获纳入恒生综合指数,此外还包括加科思、欧康维视、云顶新耀等b类医药股以及万国数据、宝尊电商等中概股,3月15日生效。
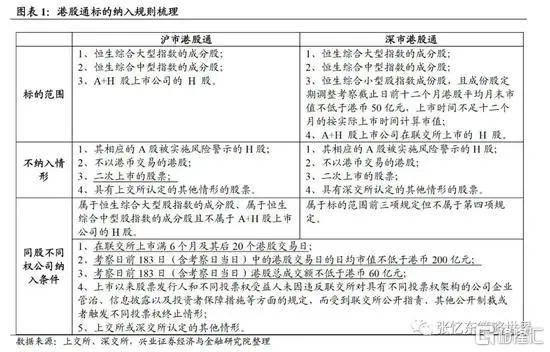
自沪深港通开通以来,港股通标的纳入范围经过数次调整后,不断扩大。2019年允许符合要求的同股不同权公司纳入港股通标的,2020年未盈利的生物科技公司也被允许纳入港股通标的。
同股不同权公司纳入港股通标的。2019年10月18日,沪深证交所表示,符合要求的同股不同权港股公司可以纳入港股通标的,自2019年10月28日施行。
未有盈利的生物科技公司纳入港股通标的。2020年11月27日,沪深港三所经协商一致同意,对于根据香港联合交易所有限公司《主板上市规则》第18A章节上市的生物科技公司的股票,如果其属于相关恒生综合指数成份股或沪深港交易所上市的A+H股上市公司H股的,该股票将根据沪深港通现有规定调入港股通股票范围。
也就是说,除了宝尊电商、万国数据等二次上市股票,世茂服务、华润万象、融创服务、新城悦复星旅文、恒大物业、泡泡玛特、蓝月亮、海尔智家等将于3月15日纳入港股通。
生效日前后,新增纳入港股通标的具有明显超额收益
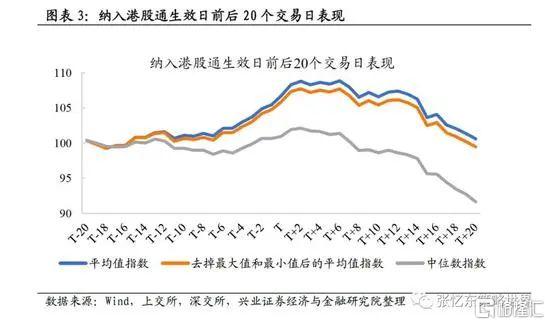
张忆东表示,从整体角度对510条纳入记录进行分析,计算生效日期前后20个交易日股票相对于恒生港股通指数的相对收益的平均值、中位数以及剔除最大最小之后的平均值,并分别构建相应的累计相对收益指数。以T日为纳入港股通生效日,T-n为纳入港股通生效日前n日,T+n日为生效日后n日。经过研究可以发现:
以平均值计算得到的指数来看,从T-7日,即生效日前7个交易日开始,指数开始逐渐攀升,在T+2日达到最大值,此后维持高位至T+6日,T+7日开始逐渐下降,在T+18或T+19日后相对收益消失。
以中位数计算得到的指数从T-7日起开始上升,T+2日达到最大值,此后逐渐回落,在T+10日回落至上升前的水平。
由于恒生指数每半年定期调整纳入港股通名单,披露日至生效日之间的间隔一般在13个交易日至18个交易日。(除2015年下半年38个交易日(2015年下半年纳入港股通生效日较其余年份晚约一个月)、2018年下半年22个交易日)。因此,结合上面的数据,可以看出,相对收益主要是围绕正式生效日前后演绎,而非披露日。
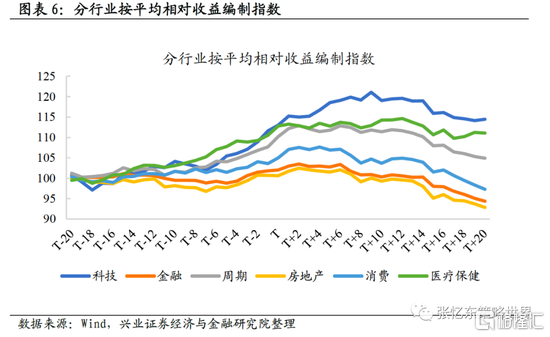
分行业来看,以恒生综合行业分类统计,资讯科技业相较于其他行业具有明显的优势——相对收益高,维持时间长。平均累计相对收益数据显示,从T-20到T+9日,恒生科技类的股票累计平均超额收益高达20%,而到T+20交易日累计平均超额收益仍有14%。
其次是医疗保健。从T-20到T+12日,恒生医疗保健行业的股票累计平均超额收益达到14%,而到T+20交易日累计平均超额收益仍有11%。
以原材料业和工业为代表的周期行业,以及消费业表现居中,累计相对收益的最高值分别为12%、7%,到T+20个交易日累计平均超额收益回落至4%和-3%。
房地产、金融等传统“类债券”行业股价表现没有明显的超额收益。
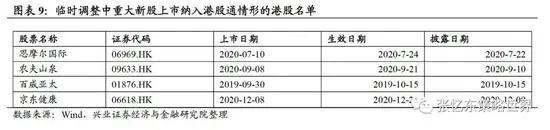
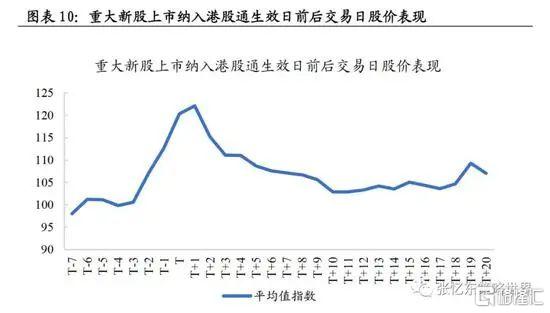
张忆东表示,市值大,排名位列恒生综合指数现有成份股的前10%,市场热度高。
因此,可以理解纳入港股通后,南下资金进一步点燃了市场对于这类股票的热情,生效日前后7个交易日内,这类股票相对收益较高、波动较大,累计超额收益自T-3日开始大幅上升,在T+1日达到最高点,累计平均超额收益达到22%,但波动也较大,T+2日之后平均超额收益大幅下降,到T+10日仅余2%。(不过,由于此类股票样本较少,有待样本量增多之后进一步研究。)
Follow us
Find us on
Facebook,
Twitter ,
Instagram, and
YouTube or frequent updates on all things investing.Have a financial topic you would like to discuss? Head over to the
uSMART Community to share your thoughts and insights about the market! Click the picture below to download and explore uSMART app!

Disclaimers
uSmart Securities Limited (“uSmart”) is based on its internal research and public third party information in preparation of this article. Although uSmart uses its best endeavours to ensure the content of this article is accurate, uSmart does not guarantee the accuracy, timeliness or completeness of the information of this article and is not responsible for any views/opinions/comments in this article. Opinions, forecasts and estimations reflect uSmart’s assessment as of the date of this article and are subject to change. uSmart has no obligation to notify you or anyone of any such changes. You must make independent analysis and judgment on any matters involved in this article. uSmart and any directors, officers, employees or agents of uSmart will not be liable for any loss or damage suffered by any person in reliance on any representation or omission in the content of this article. The content of the article is for reference only and does not constitute any offer, solicitation, recommendation, opinion or guarantee of any securities, virtual assets, financial products or instruments. Regulatory authorities may restrict the trading of virtual asset-related ETFs to only investors who meet specified requirements. Any calculations or images in the article are for illustrative purposes only.
Investment involves risks and the value and income from securities may rise or fall. Past performance is not indicative of future performance. Please carefully consider your personal risk tolerance, and consult independent professional advice if necessary.


