李宁(2331.HK):年报超预期,20年盈利能力仍在上行通道,维持“买入”评级
机构:东吴证券
评级:买入
投资要点
事件:公司公布年报,收入同增 32%至 138.7 亿元,归母净利同增 109.6%至 15.0 亿元,若剔除 2.34 亿红双喜土地出让带来的一次性收益,主业利润同比增长 74% 至 12.66 亿元,主业净利润率由 6.8%提升至 9.1%(+2.3pp) 。
强劲零售增长带动各渠道收入增长同时盈利能力提升。 2019 年公司成人装全渠道零 售流水增长 28%,其中线上增长 30%-40%高段,线下增长 26%(ASP 的增长贡献 低双位数、量的增长贡献中双位数) 。高零售流水带动公司线上/线下加盟/线下直营 报表收入增长 41%/40%/16%,其中:1)线上:溯系列为代表的线上专供款受到追 捧,ASP 上升带动毛利率提升;2)线下加盟:可比同店低双位数增长,门店数量 同比增加 319 家店至 5157 家(包含部分之间应转加盟门店),拿货折率上行带动毛 利率增长,以加盟渠道为主的中国李宁系列独立门店数量达到 120 家(2018 年为 23 家);3)线下直营:可比同店低双位数增长,门店数量同比减少 214 家至 1292 家,老店的同店持续提升叠加单产更高的次新门店带动直营渠道收入增长 16%的同 时营业利润率提升 3pp 至高双位数。由于 2019 年公司所有渠道都呈现收入增长同 时盈利能力提升现象,公司营业利润同比增长 99%至 15.4 亿元,营业利润率提升 3.7pp 至 11.1%,高于此前公司 3.0-3.5pp 提升的指引,带动 2019 年主业利润的超预 期。
收入高增同时更出色的营运资本管理。2019 年公司存货绝对值增长 13.5%至 14.1 亿元,但周转效率提升明显,整体存货从 4.9 个月下降到 4.2 个月,店铺存货从 4.2 个月下降到 3.4 个月;应收账款绝对值下降 26%至 6.9 亿元,由此公司在收入大涨 32%的同时营运资本下降 16%,带动经营现金流同比大增 110%,即使剔除会计准 则变化带来的影响,经营性现金流同比也有 90%的增长。
2020 年展望:现金储备充分,开源节流,盈利能力有望继续提升。不考虑疫情影 响,公司原有20年收入增长目标为中双位数到高双位数,净利率提升至10%-10.5%, 疫情发生后公司迅速响应,执行开源节流及控制库存工作,3 月初零售下滑幅度在 4 成左右,月末收窄至 2 成。考虑疫情影响,公司预计 20 年:1)收入端:上半年 收入持平或微降,下半年需视疫情情况而定;2)毛利率端:预计 20H1 毛利率下滑 1pp,全年下滑不超过 1pp;3)净利润率目标保持不变,较 19 年提升 0.9-1.4pp 至 10%-10.5%
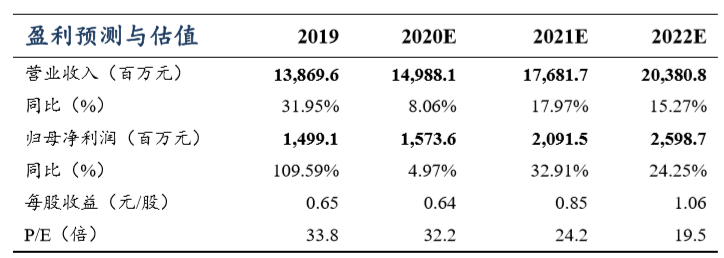
盈利预测与投资评级:准确的消费者洞察、有鲜明特色的产品矩阵以及持续年轻化 的品牌形象让公司竞争力持续提升,更细致的零售、供应链以及后台管控也让公司 在收入增长同时盈利能力连续上行,虽然 20 年上半年难免受到疫情影响,但我们 对公司长期增长仍然充满信心,预计 20/21/22 年收入同增 8%/18%/15%至 150/177/204 亿元,归母净利同增 5%/33%/24%至 15.7/20.9/26.0 亿元(其中剔除 19 年2.34亿一次性损益影响, 20年主业利润实际增长达到24%),对应估值32/24/20X, 作为产品年轻化、管理精细化的龙头标杆企业值得持续关注,维持“买入”评级。
风险提示:新冠疫情影响持续时间超出预期,李宁品牌或相关代言人影响力意外下 降,YOUNG 品牌拓展不及预期,中国李宁拓展不及预期
Follow us
Find us on
Facebook,
Twitter ,
Instagram, and
YouTube or frequent updates on all things investing.Have a financial topic you would like to discuss? Head over to the
uSMART Community to share your thoughts and insights about the market! Click the picture below to download and explore uSMART app!

Disclaimers
uSmart Securities Limited (“uSmart”) is based on its internal research and public third party information in preparation of this article. Although uSmart uses its best endeavours to ensure the content of this article is accurate, uSmart does not guarantee the accuracy, timeliness or completeness of the information of this article and is not responsible for any views/opinions/comments in this article. Opinions, forecasts and estimations reflect uSmart’s assessment as of the date of this article and are subject to change. uSmart has no obligation to notify you or anyone of any such changes. You must make independent analysis and judgment on any matters involved in this article. uSmart and any directors, officers, employees or agents of uSmart will not be liable for any loss or damage suffered by any person in reliance on any representation or omission in the content of this article. The content of the article is for reference only and does not constitute any offer, solicitation, recommendation, opinion or guarantee of any securities, virtual assets, financial products or instruments. Regulatory authorities may restrict the trading of virtual asset-related ETFs to only investors who meet specified requirements. Any calculations or images in the article are for illustrative purposes only.
Investment involves risks and the value and income from securities may rise or fall. Past performance is not indicative of future performance. Please carefully consider your personal risk tolerance, and consult independent professional advice if necessary.


