


作者:张旭 / 危玮肖
来源:EBS固收研究
摘要
本文选取了地级区划单位(包含地级市、自治州、地区、盟,包含省会及计划单列市,下文简称“地级区划单位”)为样本,综合研究了地级区划单位2019年的经济(GDP及同比增速)、财政(一般公共预算收入及财政自给率)情况。
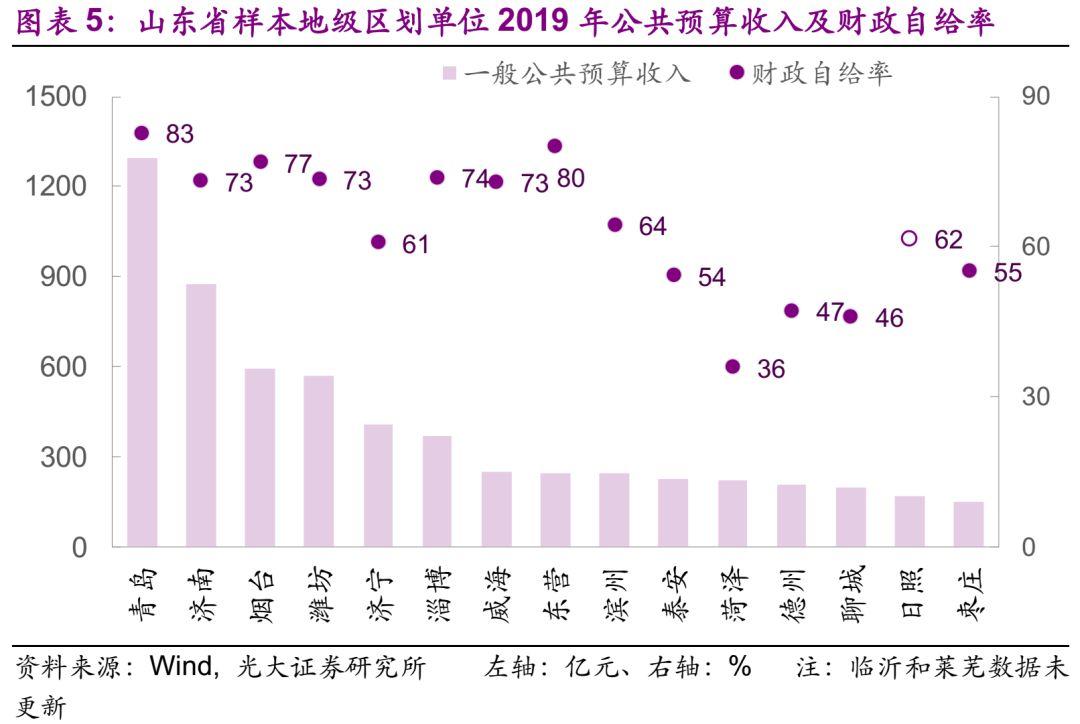
◆华东地区(安徽、江苏、山东、浙江)
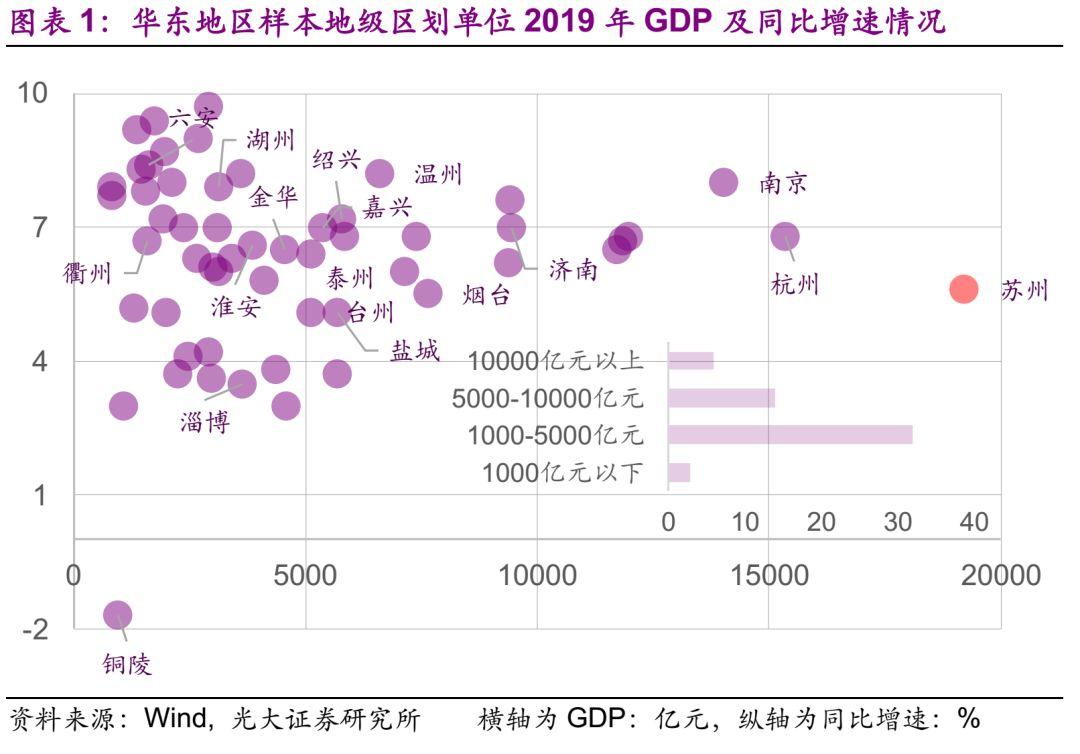
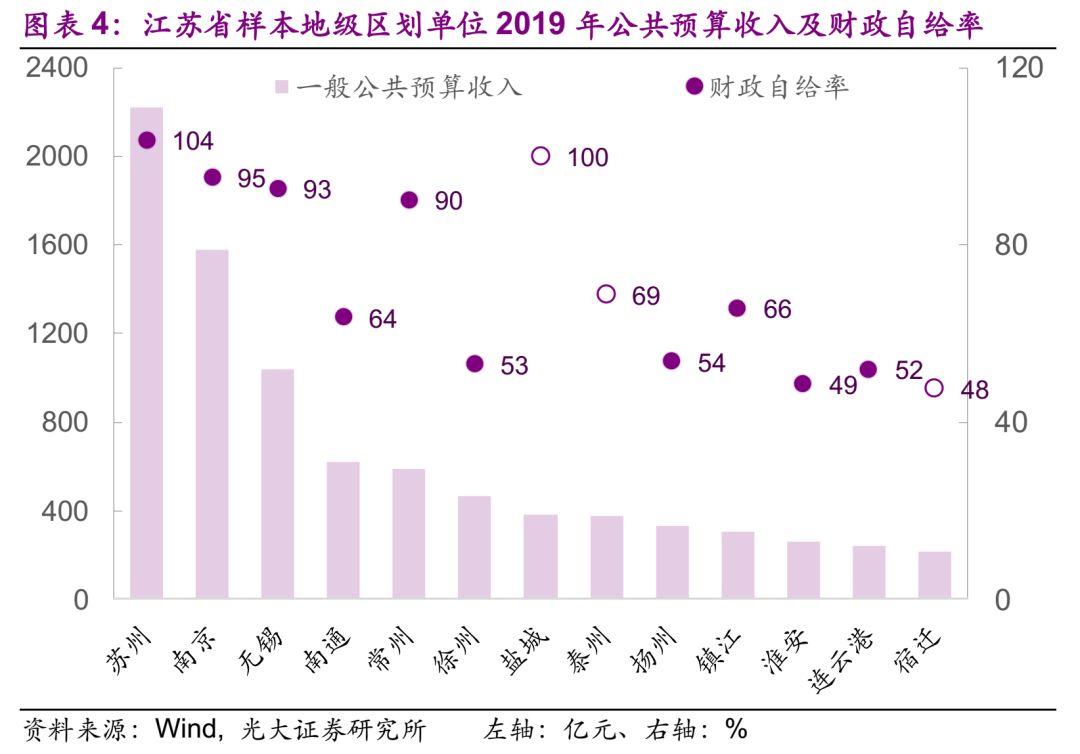
2019年GDP体量最大的仍为苏州,规模达1.92万亿。华东地区GDP规模万亿以上地级市共6个,GDP规模多处于1000-5000亿元,占比58%。从同比来看,华东地区铜陵市2019年GDP负增,增长率为-1.7%。财政方面,2019年一般公共预算收入最大的为苏州市,为2222亿元。
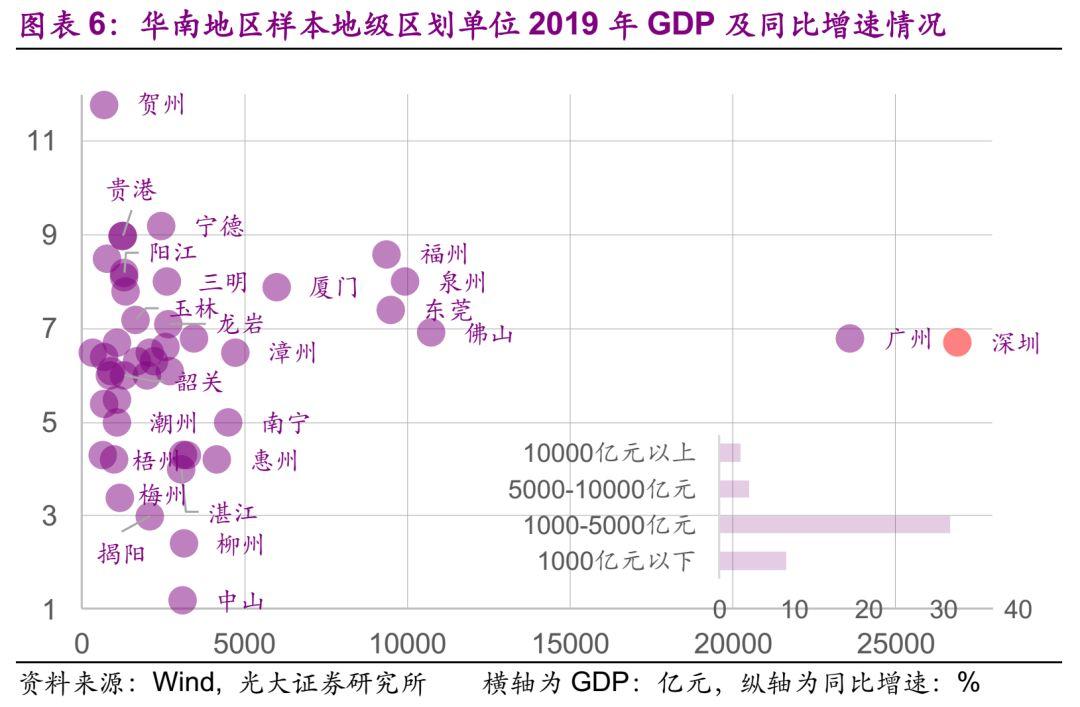
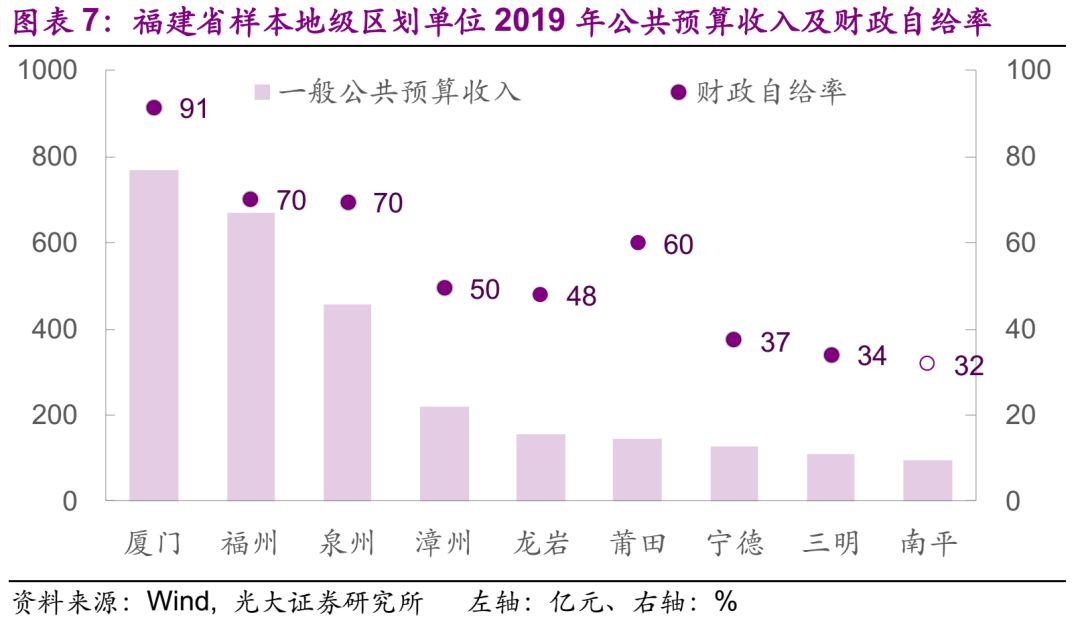
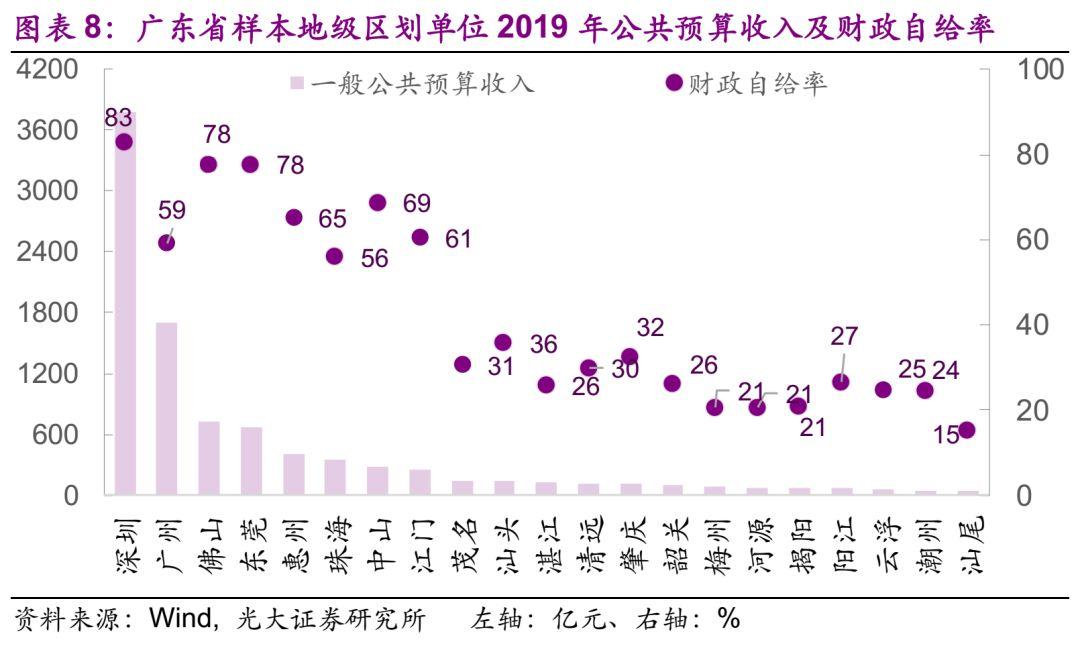
◆华南地区(福建、广东、广西、海南)
2019年GDP体量最大的为深圳,规模达2.69万亿。华南地区GDP规模万亿以上地级市共3个,其中佛山市2019年GDP体量首次突破万亿,GDP规模多处于1000-5000亿元,占比65%。财政方面,2019年一般公共预算收入最大的为深圳,为3773亿元。
◆华北地区(河北、内蒙古、山西)
2019年GDP体量最大的为唐山,规模达6890亿元,中位数为1563亿元。华北地区无GDP规模万亿以上的地级市,GDP规模多处于1000-5000亿元,占比70%。财政方面,2019年一般公共预算收入最大的为石家庄。
◆华中地区(河南、湖南、湖北、江西)
2019年GDP体量最大的为武汉,规模达1.70万亿。华中地区GDP规模万亿以上地级市共2个,GDP规模多处于1000-5000亿元,占比74%。财政方面,2019年一般公共预算收入最大的为武汉,为1564亿元。
◆西南地区(贵州、四川、云南、西藏)
2019年GDP体量最大的为成都,规模达1.70万亿。西南地区GDP规模万亿以上地级市共1个,GDP规模多处于1000-5000亿元,占比59%。财政方面,2019年一般公共预算收入最大的为成都,为1483亿元。
◆西北地区(陕西、甘肃、青海、新疆、宁夏)
2019年GDP体量最大的为西安,规模达0.93万亿,中位数为702.5亿元。西北地区无GDP规模万亿以上的地级市。财政方面,2019年一般公共预算收入最大的为榆林市(西安市数据未更新),为406亿元。
◆东北地区(吉林、辽宁、黑龙江)
2019年GDP体量最大的为大连,规模达0.70万亿元。财政方面,2019年一般公共预算收入最大的为大连,为750亿元。
◆风险提示
部分地级市数据有缺失;警惕部分财政收入连续下滑的区域,综合财力较弱的地区政府偿债压力相对较大;此外,还需要警惕化解地方政府隐性债务时对区域经济造成的下滑压力。
1、华东地区(安徽、江苏、山东、浙江)
华东地区58个样本中,2019年GDP体量最大的仍为苏州,规模达1.92万亿,中位数为3410亿元。华东地区GDP规模万亿以上地级市共6个,GDP规模多处于1000-5000亿元,占比58%。从同比来看,华东地区铜陵市2019年GDP负增,增长率为-1.7%。
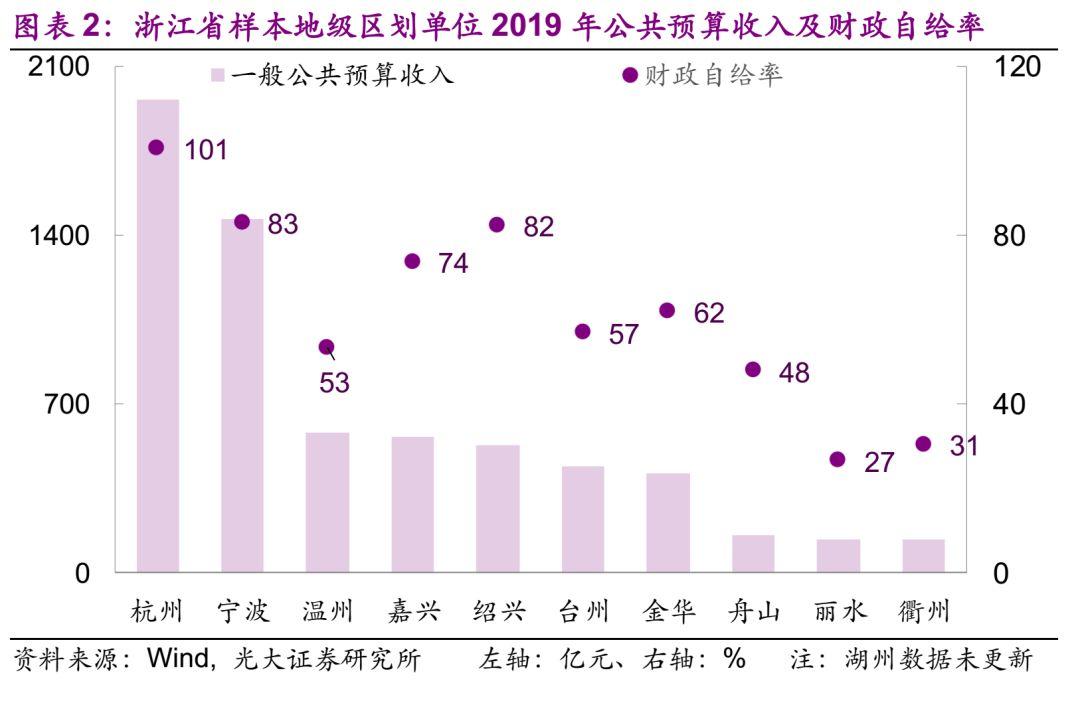
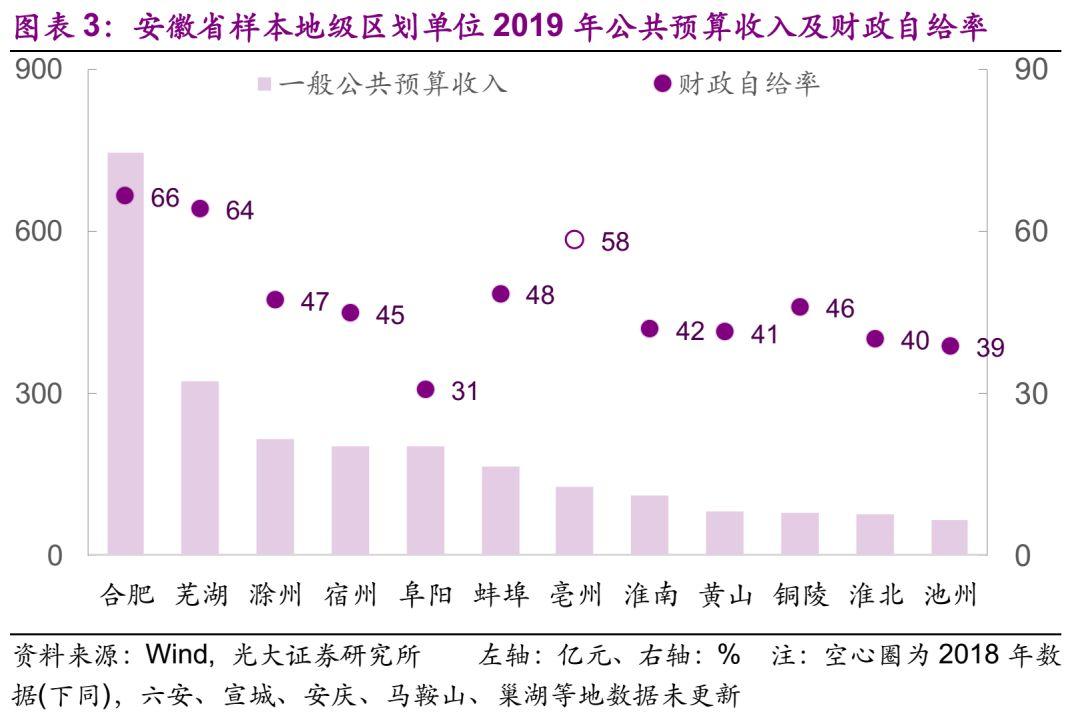
财政方面,2019年一般公共预算收入最大的为苏州市,为2222亿元,华东地区58个样本中一般公共预算收入的中位数为282亿元。
2、华南地区(福建、广东、广西、海南)
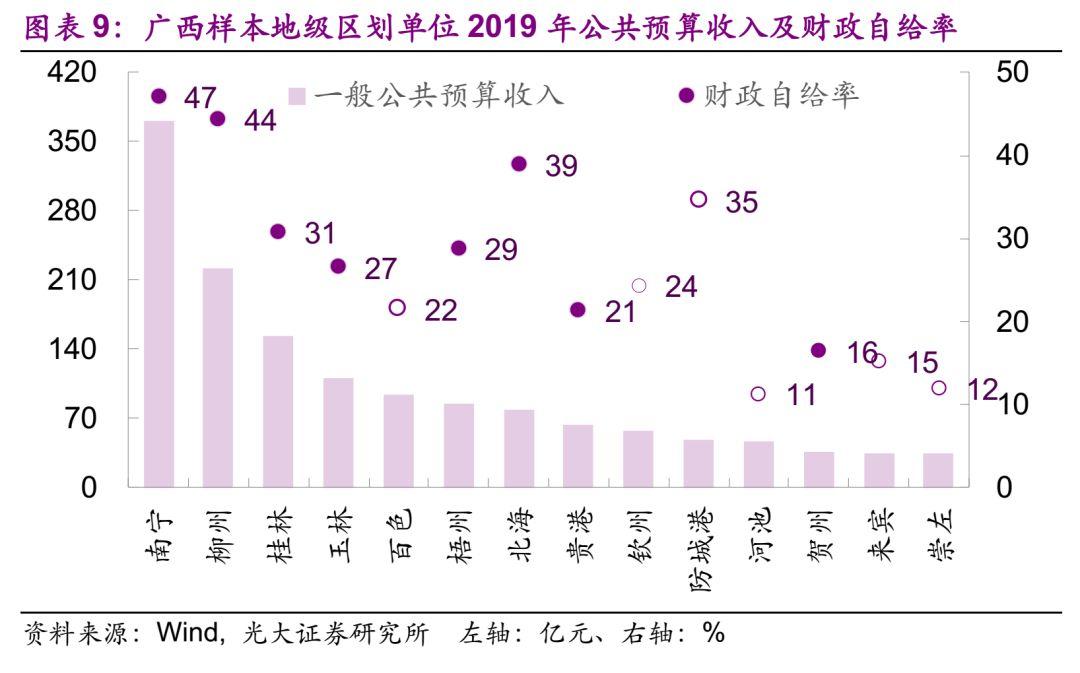
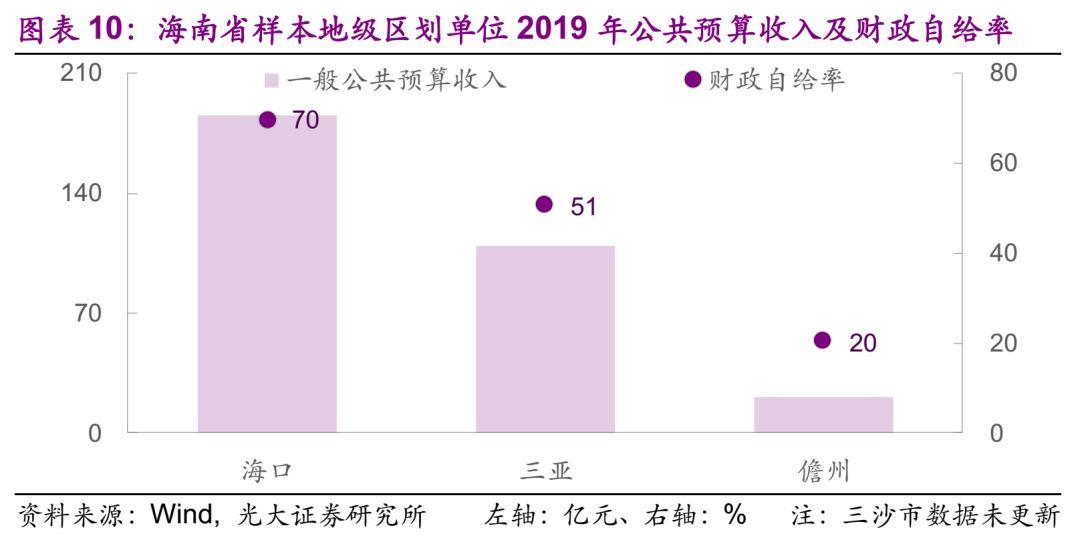
华南地区49个样本中,2019年GDP体量最大的为深圳,规模达2.69万亿,中位数为2104亿元。华南地区GDP规模万亿以上地级市共3个,其中佛山市2019年GDP体量首次突破万亿,GDP规模多处于1000-5000亿元,占比65%。
财政方面,2019年一般公共预算收入最大的为深圳,为3773亿元,华南地区49个样本中一般公共预算收入的中位数为114亿元。
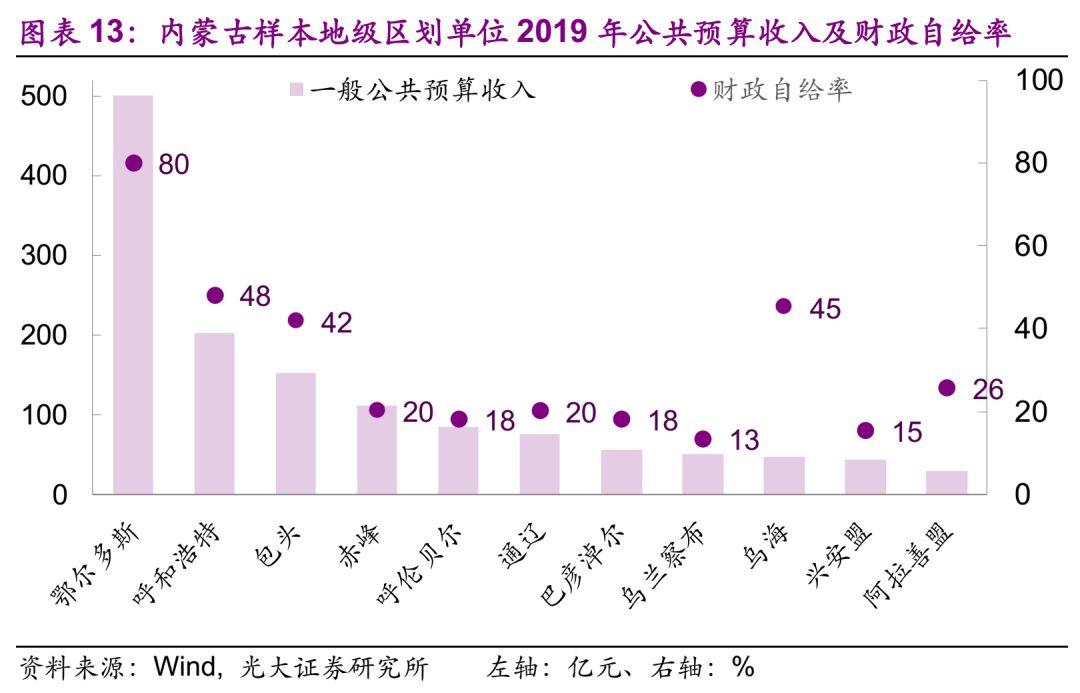
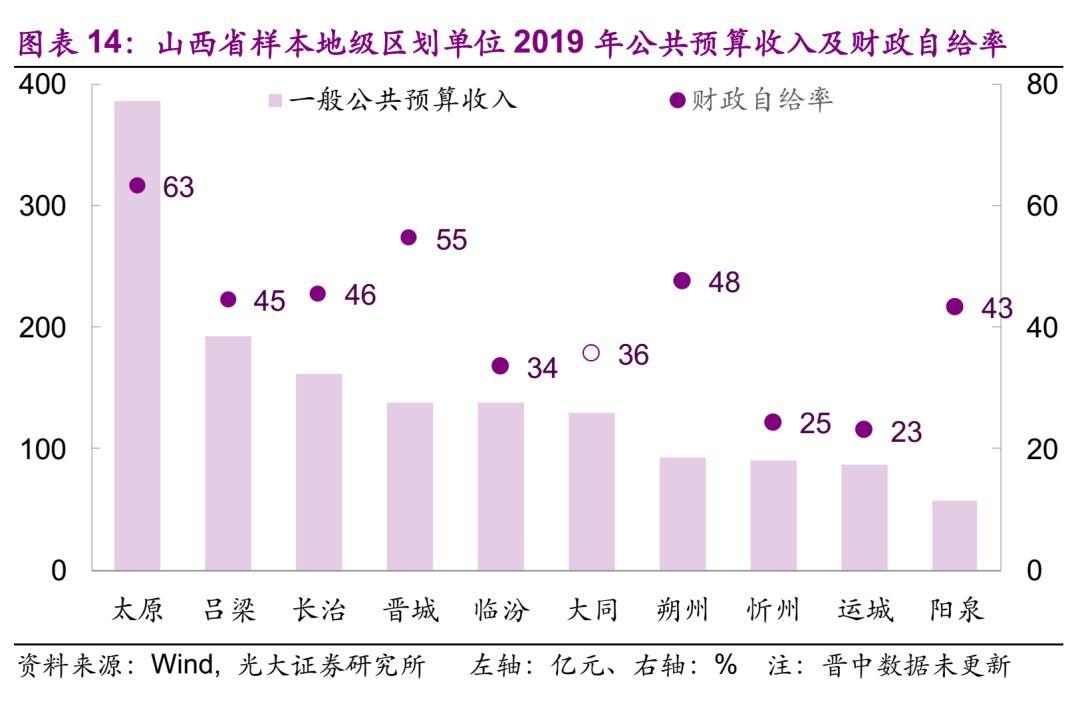
3、华北地区(河北、内蒙古、山西)
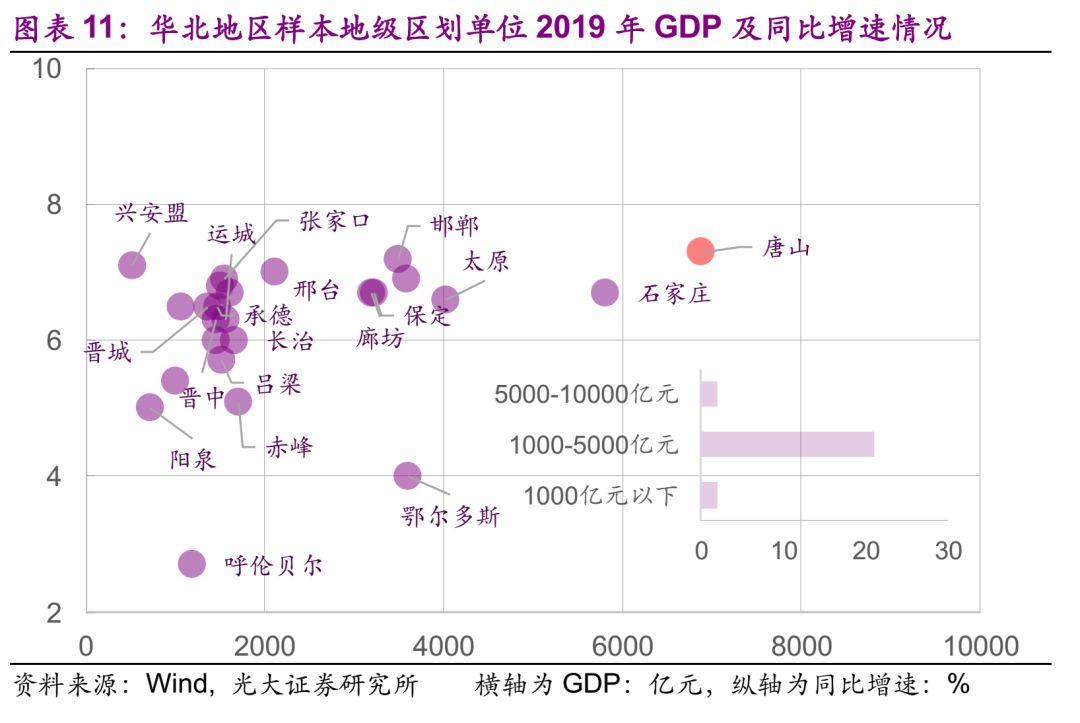
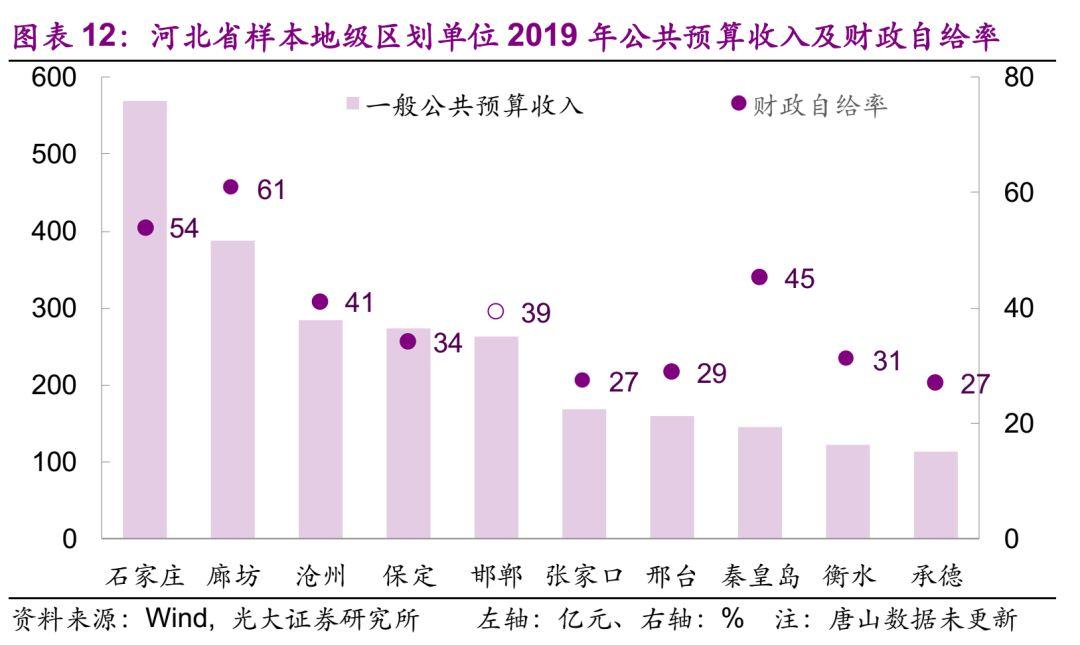
华北地区33个样本中,2019年GDP体量最大的为唐山,规模达6890亿元,中位数为1563亿元。华北地区无GDP规模万亿以上的地级市,GDP规模多处于1000-5000亿元,占比70%。
财政方面,2019年一般公共预算收入最大的为石家庄,为569亿元,华北地区33个样本中一般公共预算收入的中位数为138亿元。
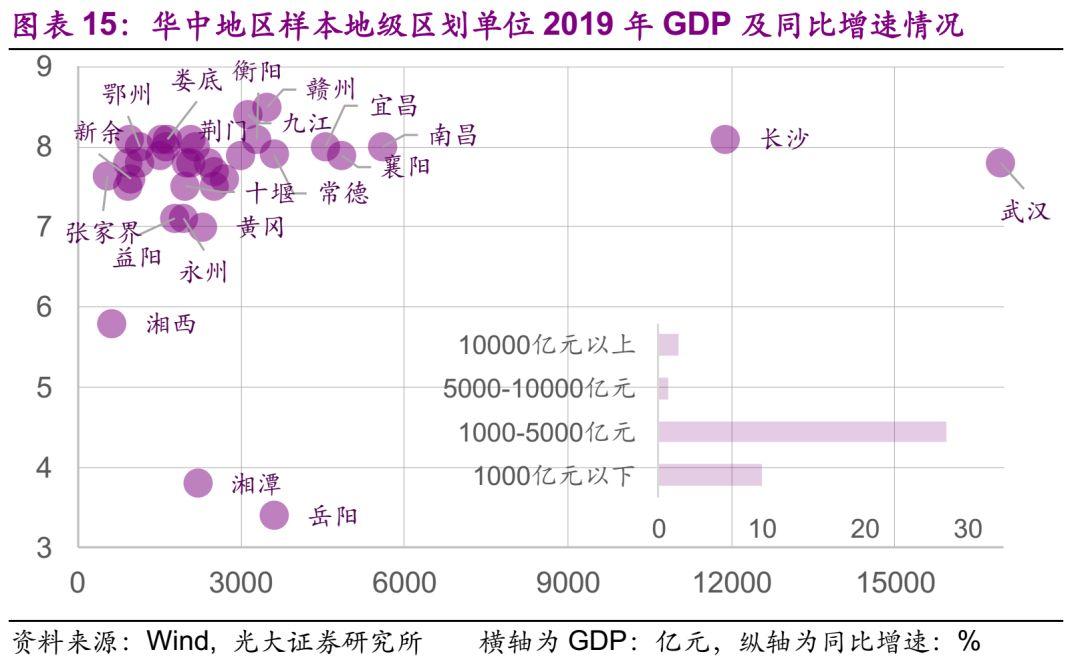
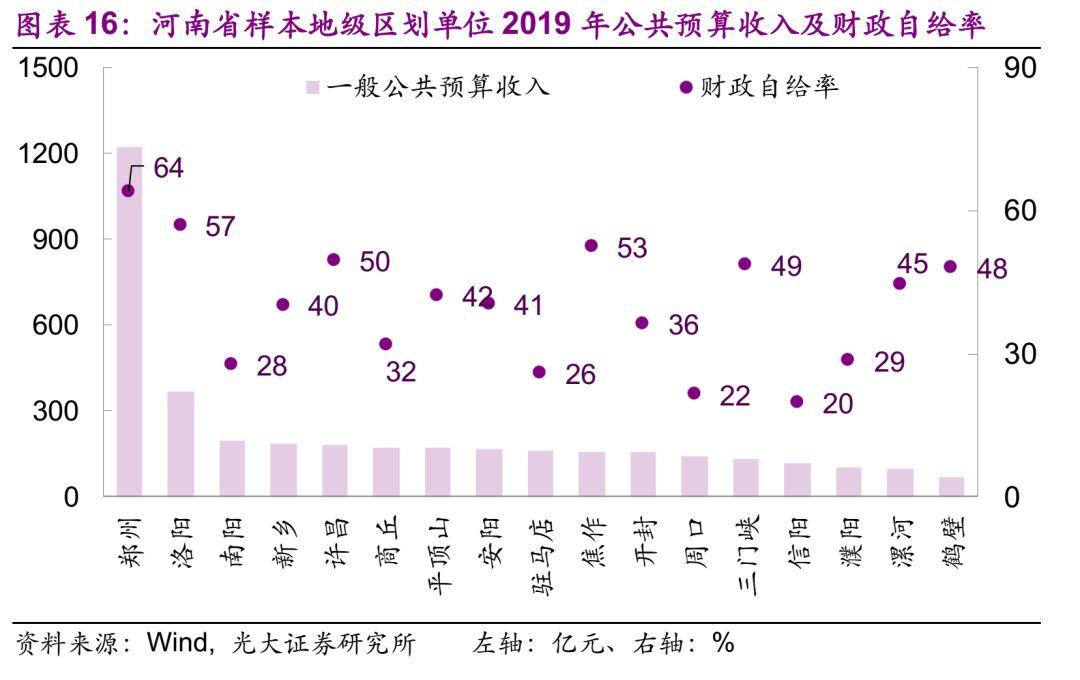
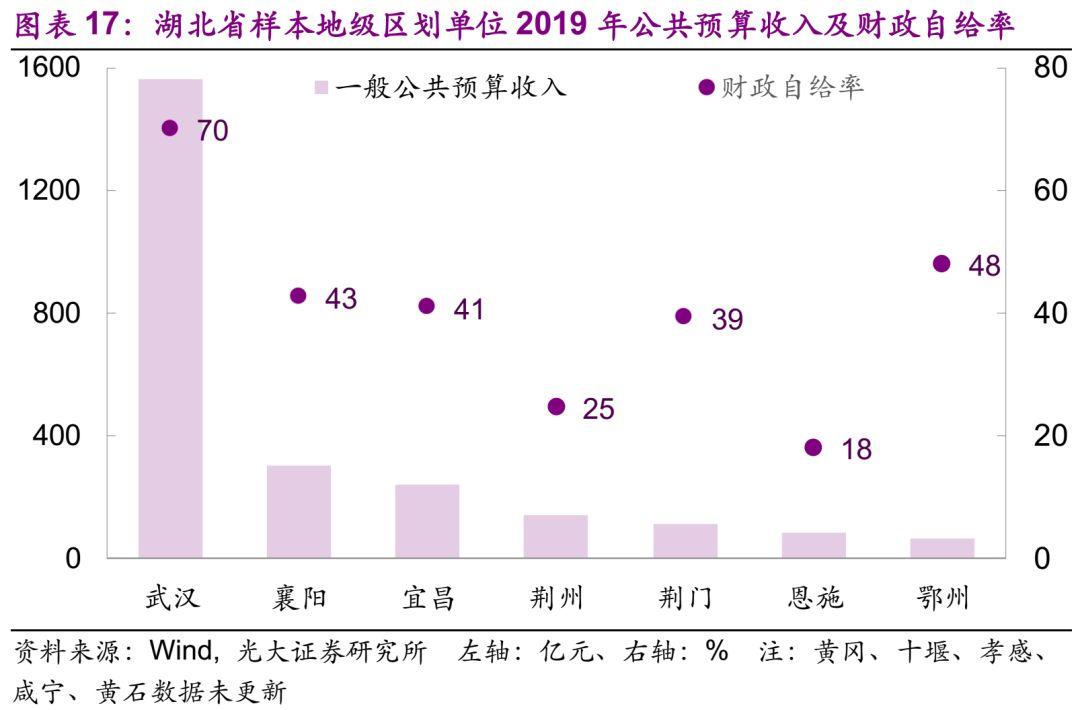
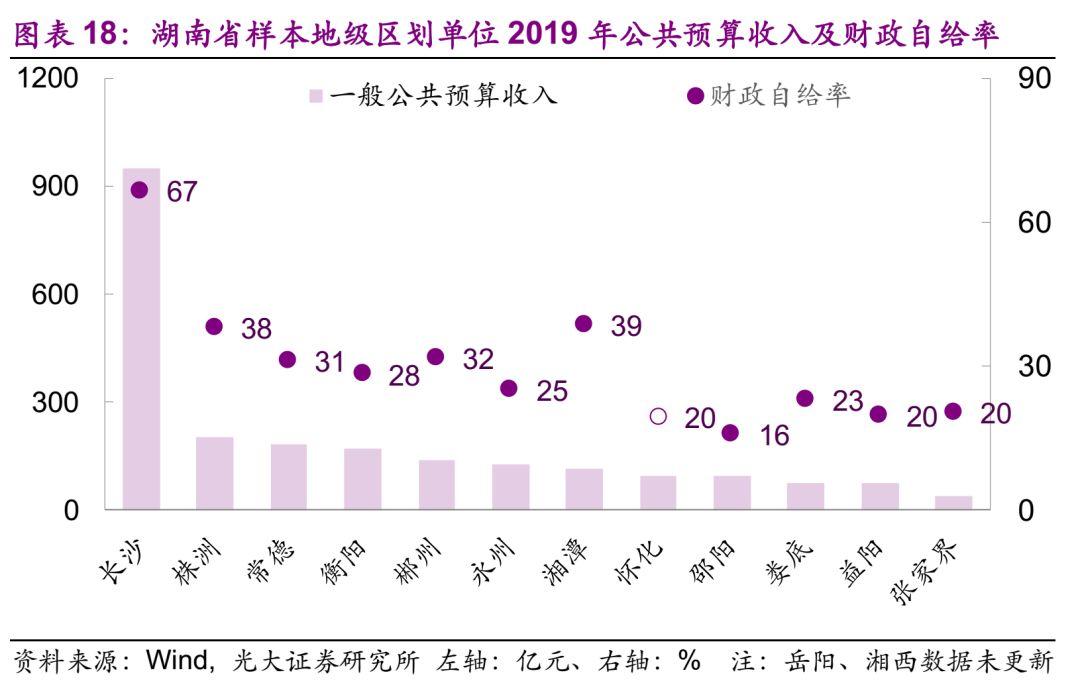
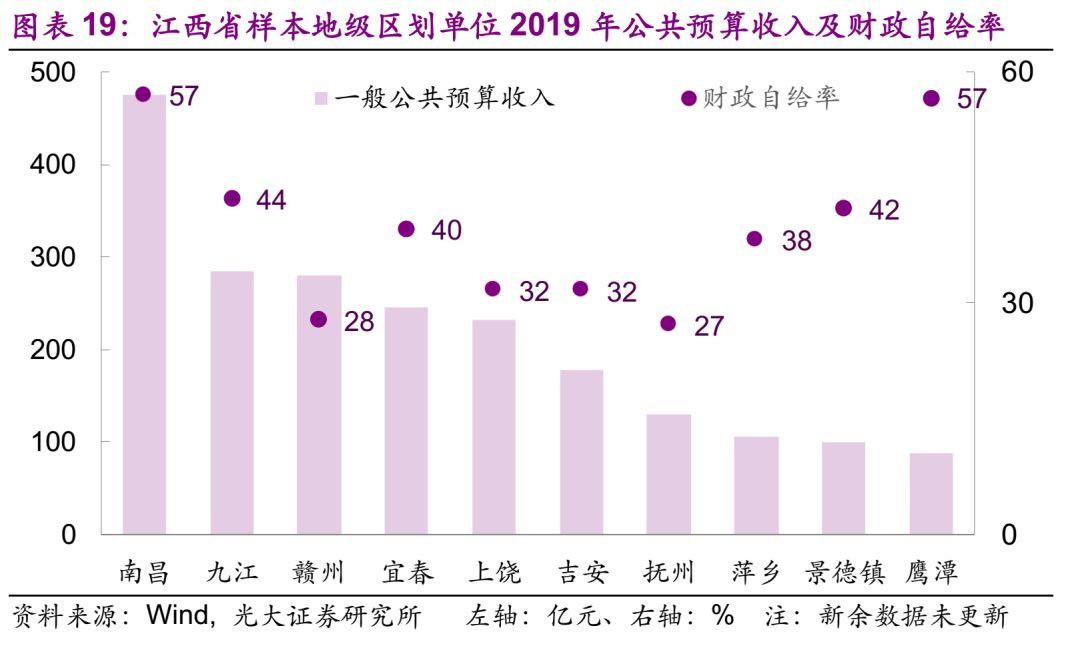
4、华中地区(河南、湖南、湖北、江西)
华中地区41个样本中(河南省尚未披露2019年各地级市GDP数据,因此样本中无河南地区),2019年GDP体量最大的为武汉,规模达1.70万亿,中位数为2000亿元。华中地区GDP规模万亿以上地级市共2个,GDP规模多处于1000-5000亿元,占比74%。
财政方面,2019年一般公共预算收入最大的为武汉,为1564亿元,华中地区59个样本中一般公共预算收入的中位数为156亿元。
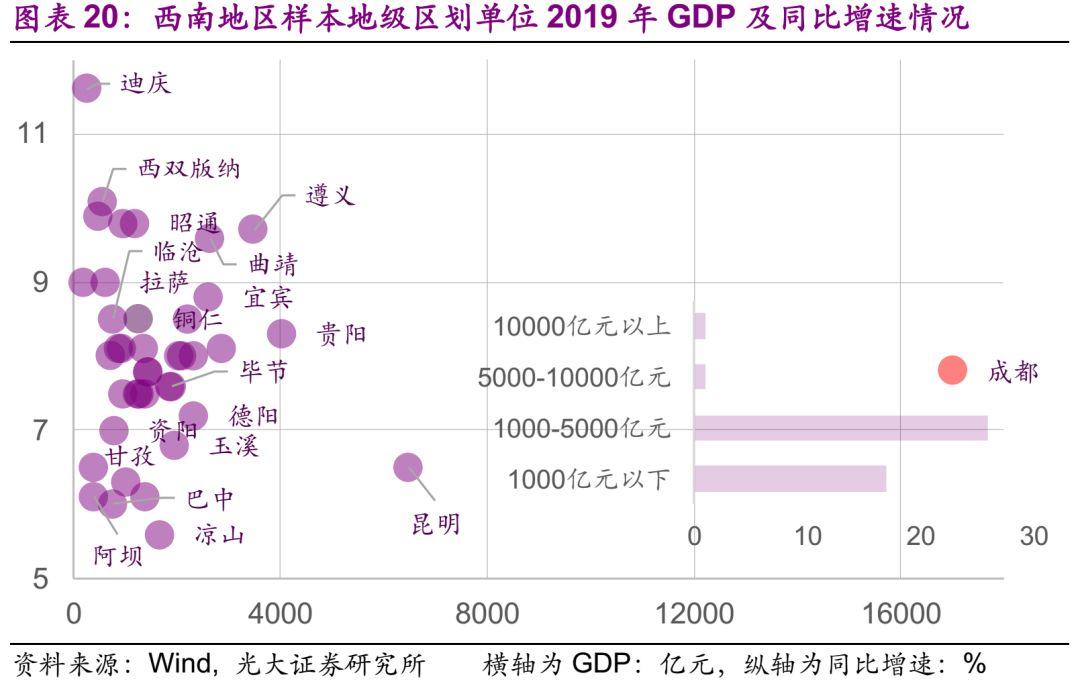
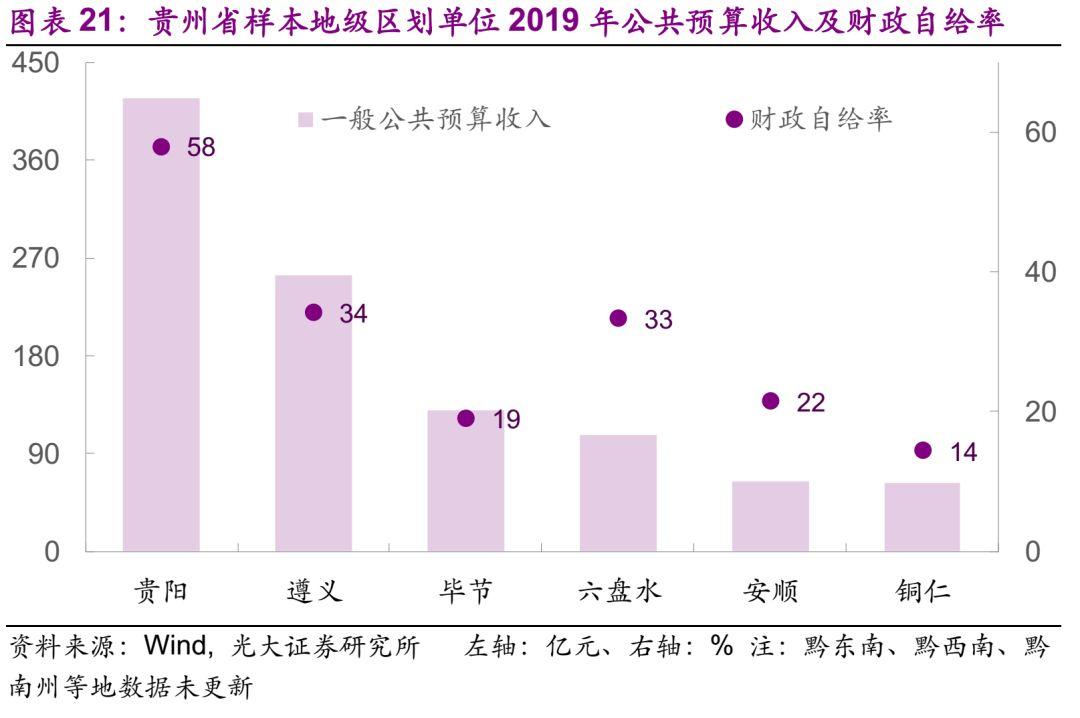
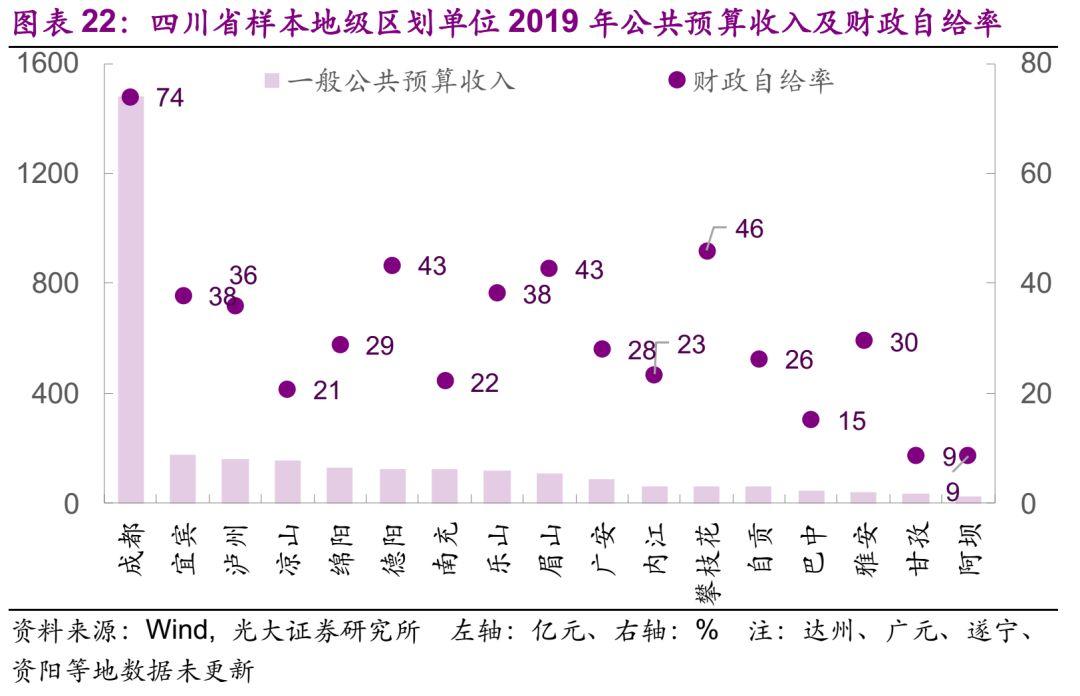
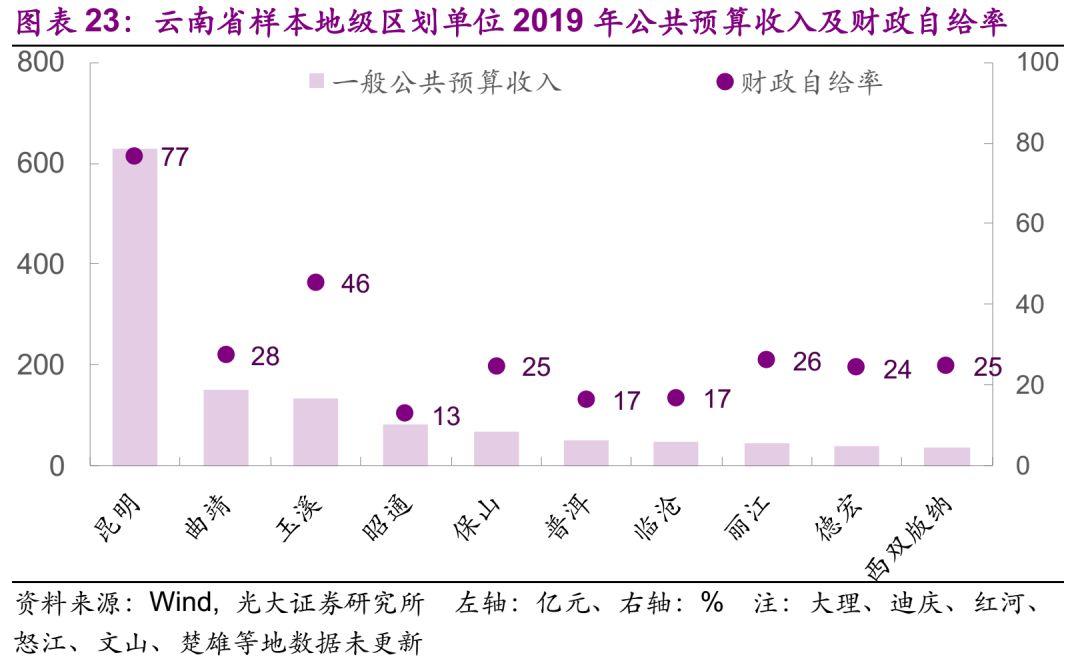
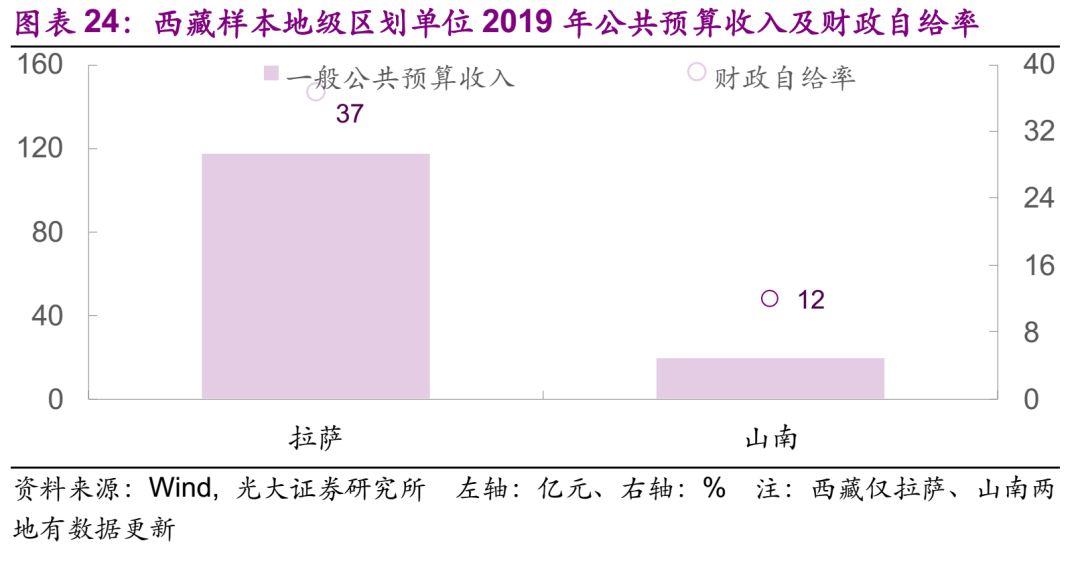
5、西南地区(贵州、四川、云南、西藏)
西南地区51个样本中,2019年GDP体量最大的为成都,规模达1.70万亿,中位数为1252亿元。西南地区GDP规模万亿以上地级市共1个,GDP规模多处于1000-5000亿元,占比59%。
财政方面,2019年一般公共预算收入最大的为成都,为1483亿元,西南地区样本中一般公共预算收入的中位数为86亿元。
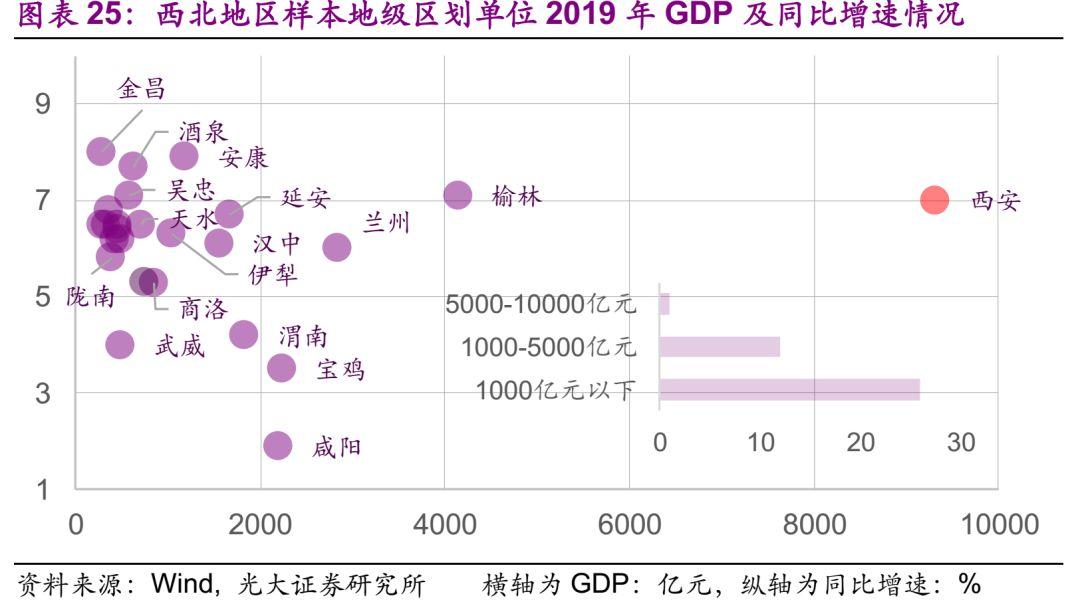
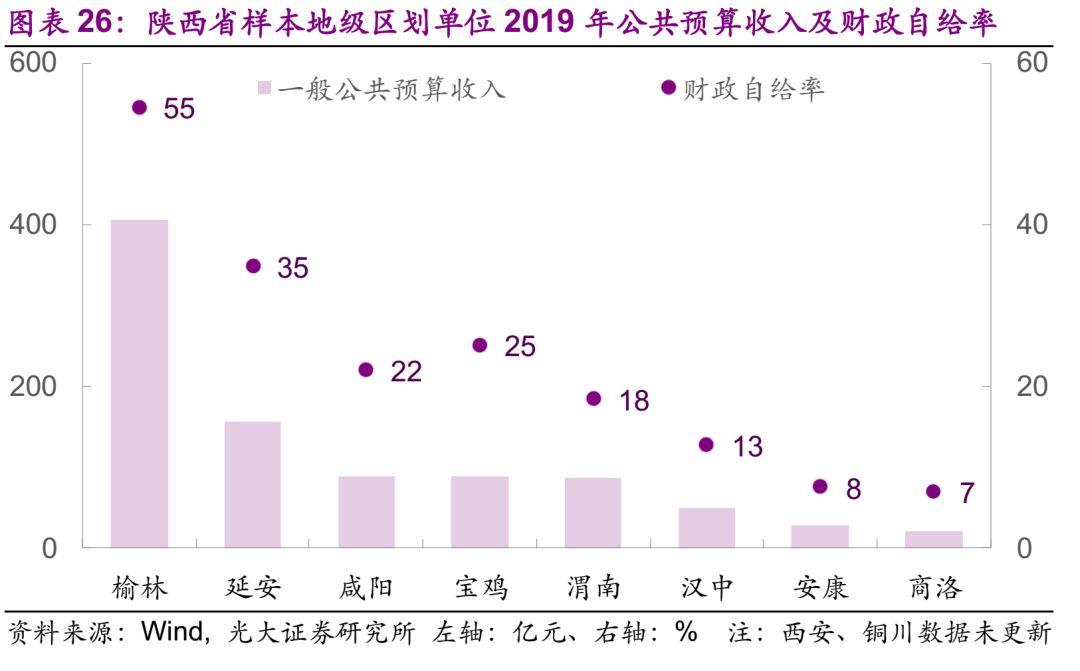
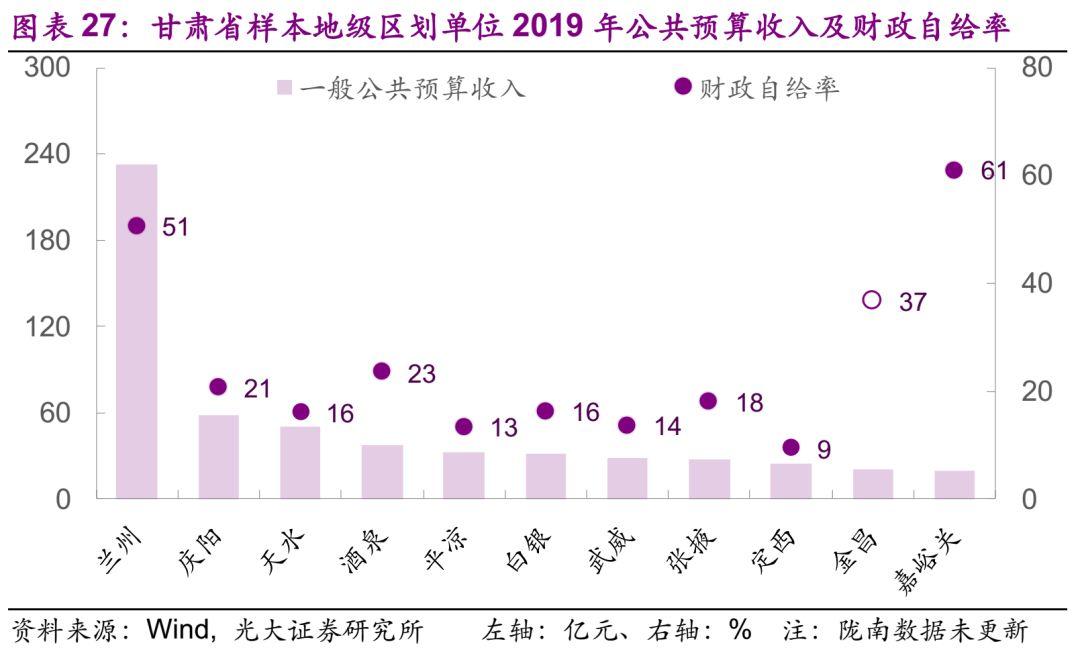
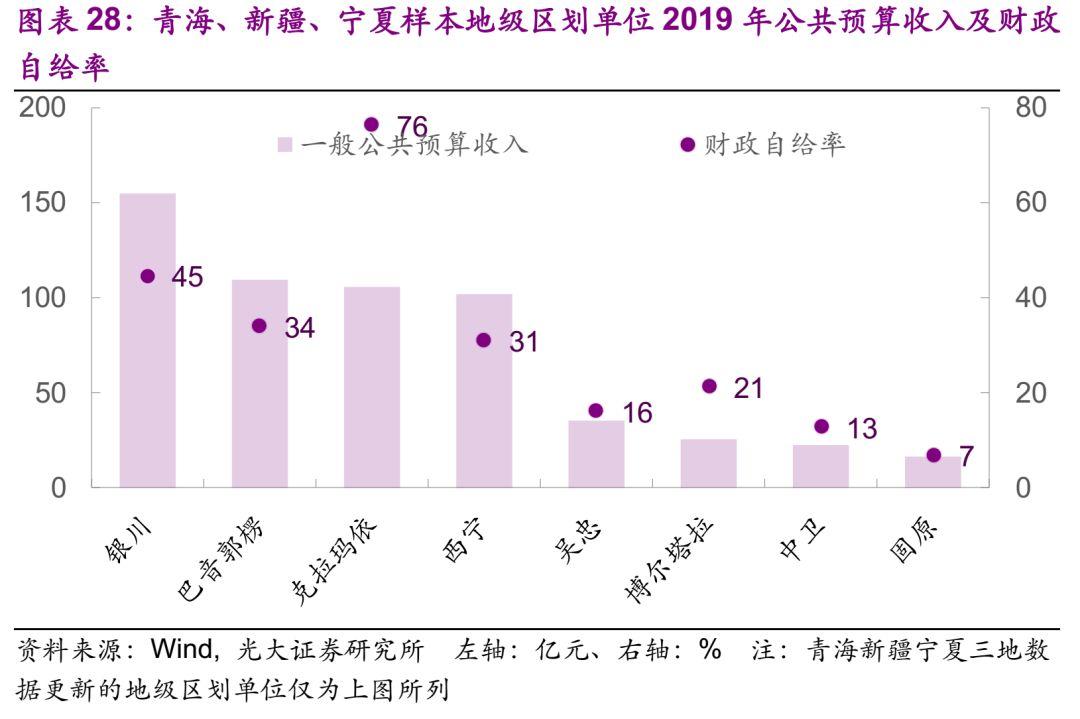
6、西北地区(陕西、甘肃、青海、新疆、宁夏)
西北地区49个样本中,2019年GDP体量最大的为西安,规模达0.93万亿,中位数为702.5亿元。西北地区无GDP规模万亿以上的地级市,GDP规模多处于1000亿元以下,占比67%。
财政方面,2019年一般公共预算收入最大的为榆林市(西安市数据未更新),为406亿元,西北地区样本中一般公共预算收入的中位数为43亿元。
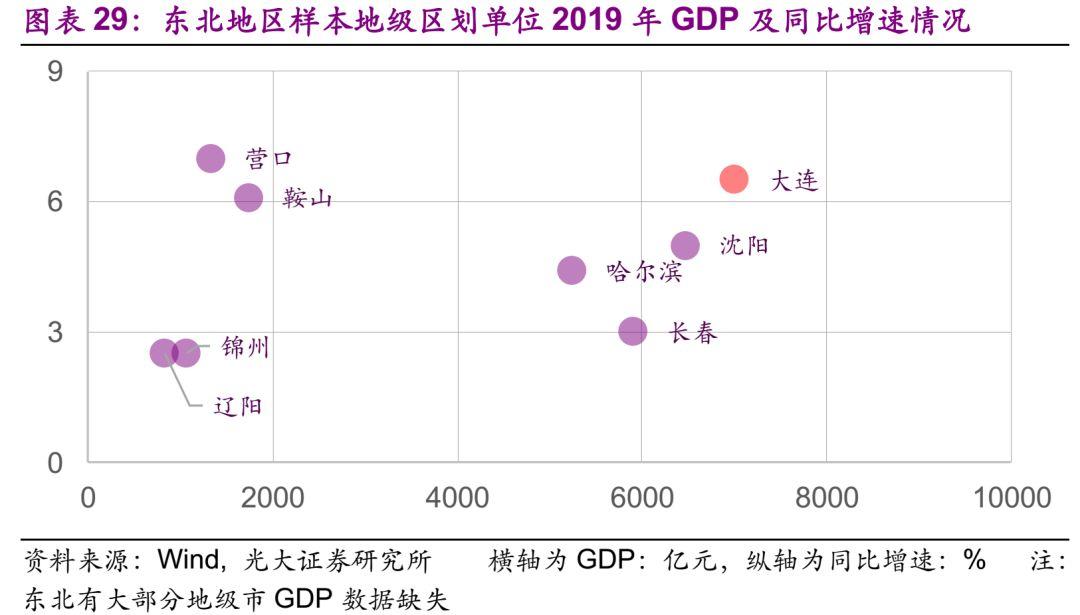
7、东北地区(吉林、辽宁、黑龙江)
东北地区8个样本中(大部分地级市尚未披露GDP数据),2019年GDP体量最大的为大连,规模达0.70万亿元,中位数为3497.35亿元。
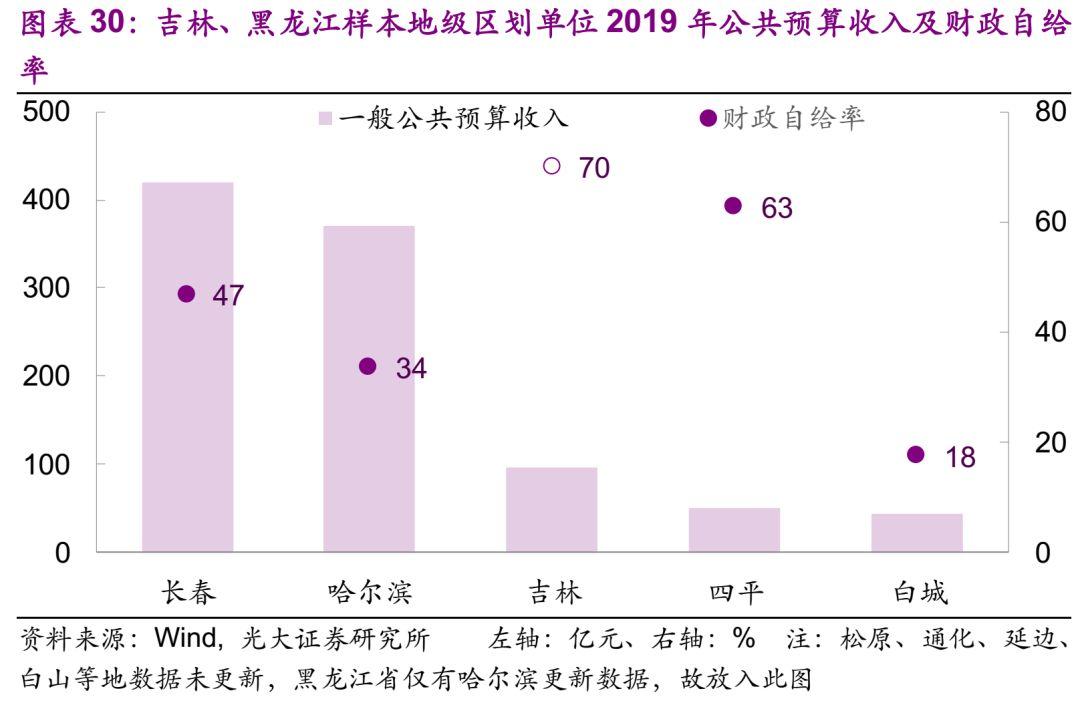
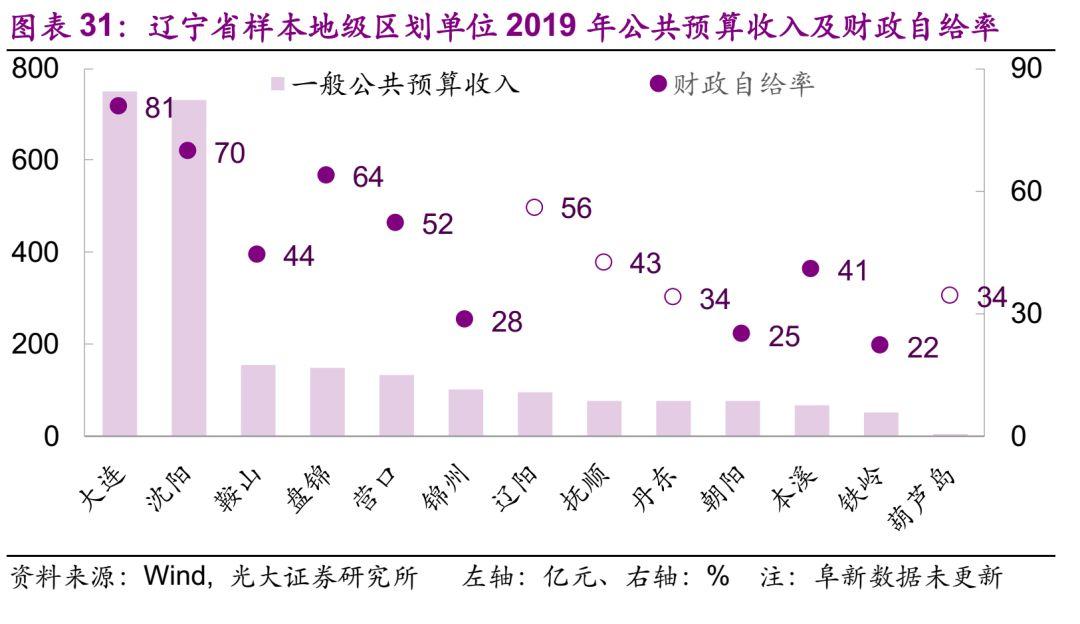
财政方面,2019年一般公共预算收入最大的为大连,为750亿元,东北地区样本中一般公共预算收入的中位数为95.3亿元。
8、风险提示
部分地级市数据有缺失;警惕部分财政收入连续下滑的区域,综合财力较弱的地区政府偿债压力相对较大;此外,还需要警惕化解地方政府隐性债务时对区域经济造成的下滑压力。


More Content


