紐約聯儲新指標解析 :動態追蹤全球供應鏈壓力
本文來自格隆匯專欄:陶川,作者:段萌 陶川
2022年剛剛開年,紐約聯儲便推出新指標——全球供應鏈壓力指數(GSCPI),以解決現存指標大多僅聚焦特定領域、無法全面反映全球供應鏈緊俏程度的問題。GSCPI綜合了大量常用指標,能夠更全面地反映全球供應鏈的潛在中斷問題。
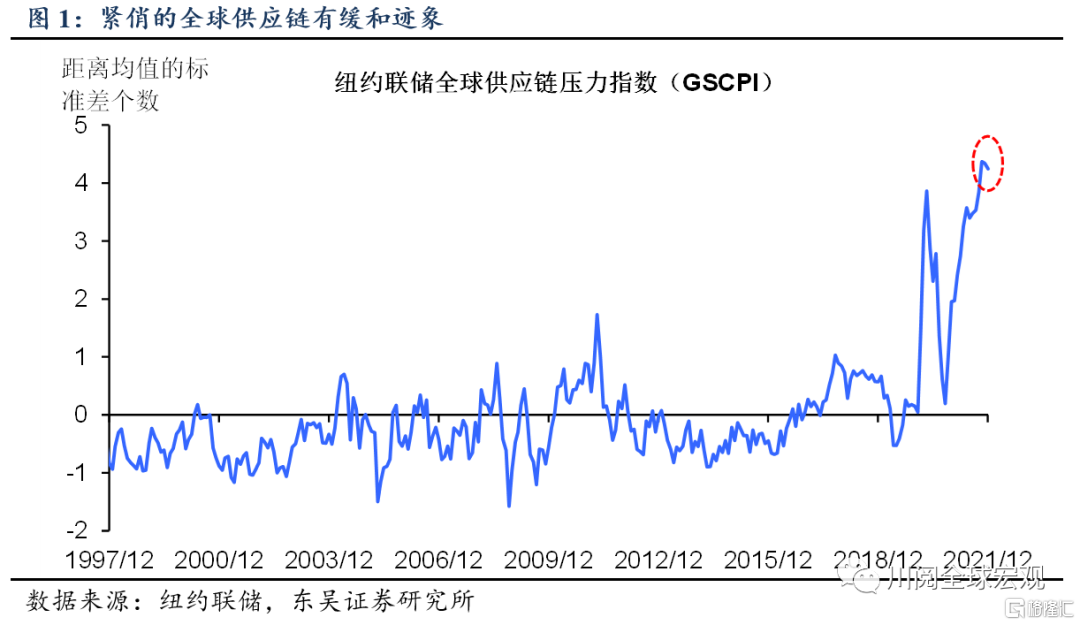
如圖1所示,GSCPI指數已被標準化,零表示平均值,零以外的數據代表其偏離平均值的程度。2020年以來隨着供應短缺的加劇,GSCPI指數飆升,但2021年末該指數有見頂回落的跡象。
GSCPI的構建邏輯是什麼?彙集27個供應鏈相關變量(21個各地區PMI分項指標+2個海運成本指標+4個空運成本指標)。
首先,紐約聯儲的經濟學家們將供應鏈相關指標分為兩大類:
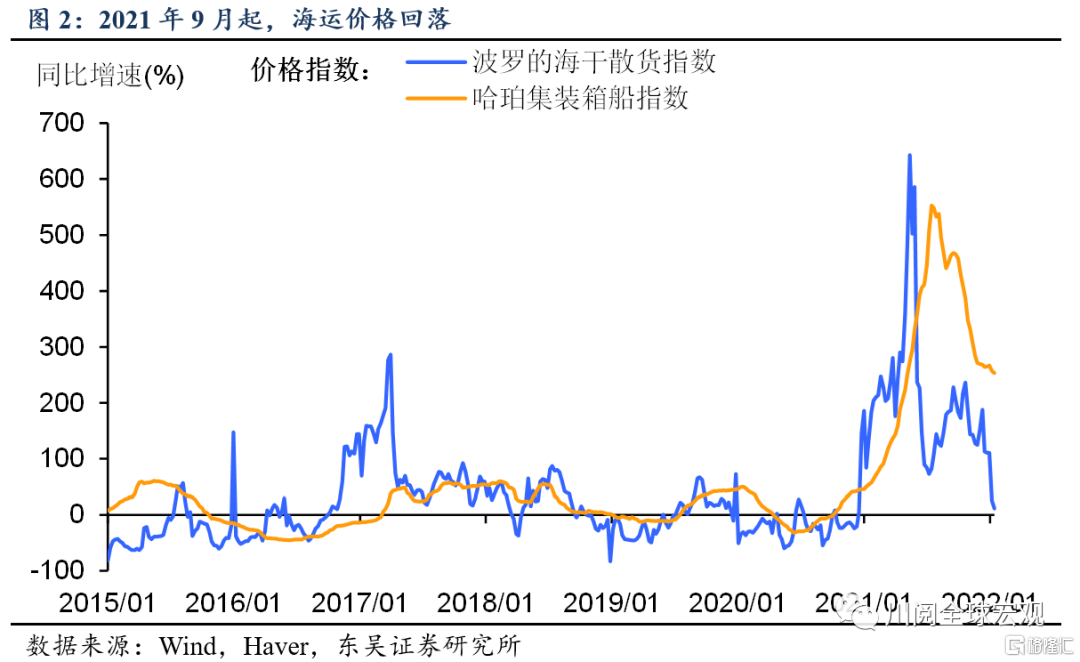
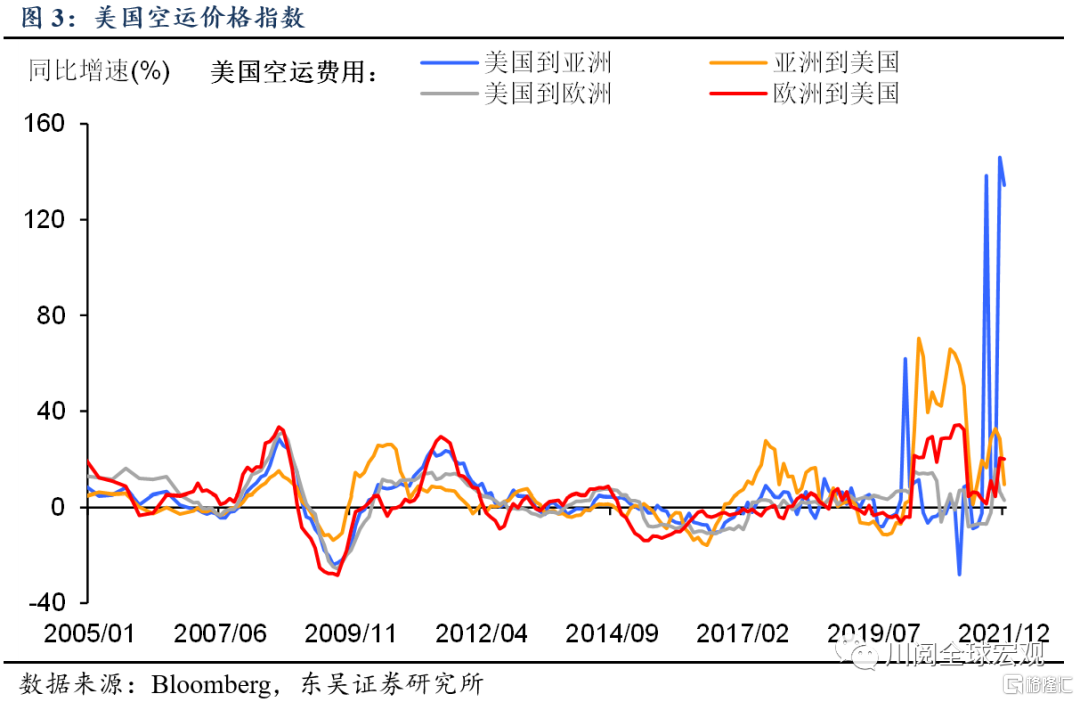
第一類聚焦跨境運輸費用。綜合考慮了原材料的運輸成本、集裝箱船運價以及空運價格,分別參考了波羅的海乾散貨指數、Harpex指數以及亞洲和歐洲方面往返美國的空運價格指數(圖2-圖3)。
第二類聚焦各經濟體PMI製造業數據。區域方面,覆蓋了歐元區、中國大陸、中國台灣、日本、韓國、英國和美國(時間序列都較長並且在全球供應鏈上的關聯性強)。權重方面,以各區域GDP做加權平均,計算交付時間、訂單庫存和採購庫存這三個PMI分項,來反映供給約束、庫存水平等因素。
相對於現存的評估供應鏈情況的指標,GSCPI的優勢是什麼?
紐約聯儲的經濟學家表示,現存指標之間是割裂的,僅是從不同的方面評估全球供應鏈中斷,但是沒有考慮到產業和區域間的關聯性。而近年來海運和空運的發展使得各區域產業的關聯性不斷增強,供應鏈全球化特徵彰顯。GSCPI將各區域的數據和全球運輸成本相結合,更全面地反映了全球供應鏈壓力的狀況。
剔除了需求影響的干擾項。需求和供應鏈中斷均會影響上文所述的指標,剔除需求影響後才能反映供應鏈中斷的影響,而現存指標難以做到。GSCPI提取了PMI新訂單數據(反映客户對產品的需求程度)及採購量數據,通過統計處理,剔除了需求對於上述兩類指標的影響。
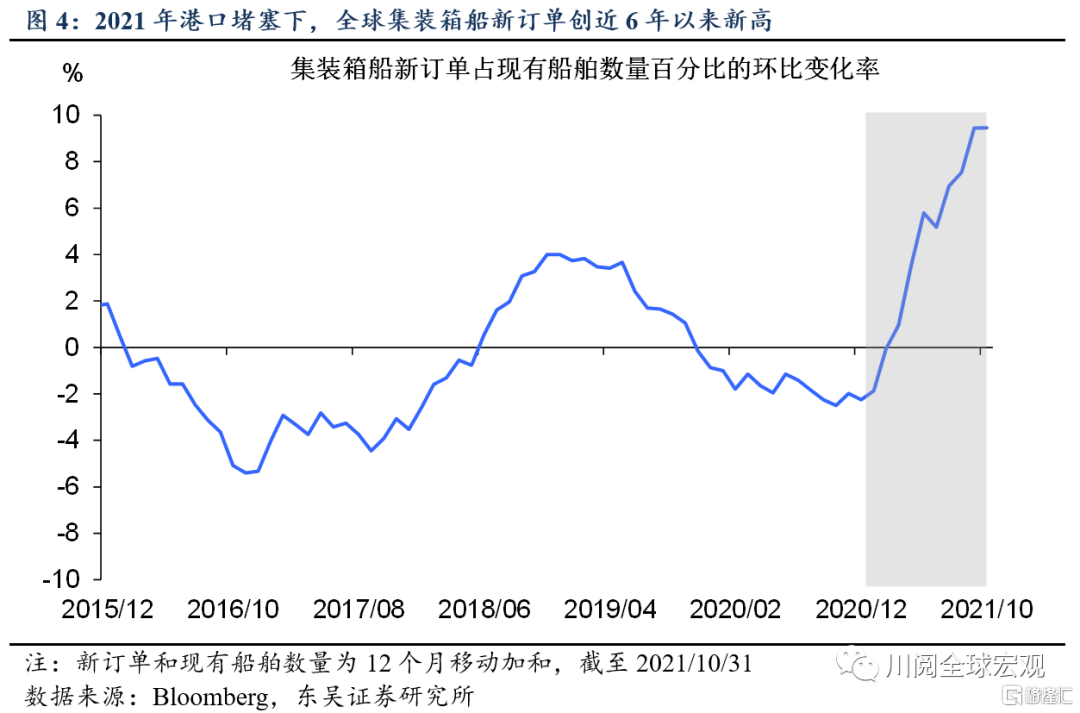
展望2022年,在奧密克戎導致的疫情反覆及各國邊境政策的階段性收緊、我國春節的物流波動下,全球供應鏈中斷可能持續至下半年。不過海運方面的壓力已於2021年見頂,一方面體現在圖2所示的海運價格回落,另一方面,2021年全球新集裝箱船訂單創近6年以來新高(圖4),2022年中,部分新船的投入使用將提升承載量。不過,鑑於港口堵塞可能會持續到2022年中,儘管海運費用呈下降態勢,但可能仍將顯著高於疫情前水平。
風險提示:新冠病毒變異導致疫苗失效,確診病例大爆發導致經濟重回封鎖
Follow us
Find us on
Facebook,
Twitter ,
Instagram, and
YouTube or frequent updates on all things investing.Have a financial topic you would like to discuss? Head over to the
uSMART Community to share your thoughts and insights about the market! Click the picture below to download and explore uSMART app!

Disclaimers
uSmart Securities Limited (“uSmart”) is based on its internal research and public third party information in preparation of this article. Although uSmart uses its best endeavours to ensure the content of this article is accurate, uSmart does not guarantee the accuracy, timeliness or completeness of the information of this article and is not responsible for any views/opinions/comments in this article. Opinions, forecasts and estimations reflect uSmart’s assessment as of the date of this article and are subject to change. uSmart has no obligation to notify you or anyone of any such changes. You must make independent analysis and judgment on any matters involved in this article. uSmart and any directors, officers, employees or agents of uSmart will not be liable for any loss or damage suffered by any person in reliance on any representation or omission in the content of this article. The content of the article is for reference only and does not constitute any offer, solicitation, recommendation, opinion or guarantee of any securities, virtual assets, financial products or instruments. Regulatory authorities may restrict the trading of virtual asset-related ETFs to only investors who meet specified requirements. Any calculations or images in the article are for illustrative purposes only.
Investment involves risks and the value and income from securities may rise or fall. Past performance is not indicative of future performance. Please carefully consider your personal risk tolerance, and consult independent professional advice if necessary.


