


 Market NewsU.S. non-farm payroll data released | VIX panic index surges, good for U.S. bond market
The latest U.S. non-farm payroll data released last Friday showed that U.S. non-farm payroll employment fell sharply to 114,000 in July from the previous value of 179,000 and was significantly lower than the expected 175,000. The unemployment rate rose to 4.3%, the highest level in three years. , triggering the recession indicator with an accuracy of 100% - Sam's rule.
What are Sam's Rules?
The "Sam's Rule" states that a recession is likely to begin when the three-month moving average of the U.S. unemployment rate rises by more than 0.5 percentage points relative to the lowest point in the past 12 months. This rule has been 100% accurate since the 1970s. And unlike other recession warning indicators such as the yield curve inversion, the interval between triggering the "Sam Rule" and the U.S. economy actually entering a recession is sometimes very short - for example, the nearly six times the "Sam Rule" was triggered to The shortest period between economic recessions is only one month, and the longest period is only four months.
(Source: Bank of America)
This has sharply increased investors' concerns about the U.S. economic recession, believing that the Federal Reserve is wrong to cut interest rates too slowly, and triggering a large-scale risk aversion. Investors in the United States, Europe and Japan have sold off stocks and poured into U.S. Treasury bonds, pushing U.S. bond yields sharply lower.
U.S. stocks plunged on Friday
On Friday, after the release of poor non-agricultural data, the three major U.S. stock indexes all fell. The S&P 500 closed down 1.84%, the Dow Jones closed down 1.51%, and the Nasdaq index plummeted 2.4%, reaching its highest point since early July. It has fallen by more than 10% cumulatively.
(Source:Wall Street Journal)
Most Chinese concept stocks fell. The Nasdaq Golden Dragon China Index closed down 1.84% and fell 5.9% for the week. Among ETFs, the China Concept Internet Index ETF (KWEB) closed down 1.16%, down 3.14% this week for three consecutive weeks, and the China Technology Index ETF (CQQQ) closed down 0.8%, down 0.76% this week.
Technology stocks in the U.S. stock market plummeted even more. Due to poor financial performance, Intel's stock price plummeted 26%. In Mag7, except for Apple, which closed slightly higher, the rest fell across the board. Amazon shares fell 8.8% after announcing a profit outlook that was lower than Wall Street expectations. Microsoft and Meta both fell 2%.The market value of the seven technology giants has evaporated an astonishing US$2.3 trillion since its peak in early July.
(Source:Wall Street Journal)
Even small-cap stocks that had been popular before also fell sharply. The Russell 2000 index closed down 3.52% on Friday and fell 6.67% this week.
(Source: uSMART)
Rising expectations of rate cuts have prompted massive inflows into small-cap stocks over the past month. Because small businesses tend to benefit more from interest rate cuts without a sharp slowdown in the U.S. economy that hurts profits. But now, the economic outlook has worsened.
Stuart Kaiser, head of U.S. stock trading at Citibank, pointed out that these sell-offs reflected typical risk aversion, with investors choosing to clear some of their positions for risk aversion amid disappointing economic data and pressure on corporate profits.
VIX surges, market risk aversion rises sharply, U.S. bonds rise for seventh consecutive year
Amid the turmoil in the U.S., European and Japanese stock markets, the VIX panic index closed up 26.04% on Friday at 23.43. It once approached the 30 mark during the night trading session, setting the highest level since the banking crisis in March last year.
(Source: uSMART)
Amid strong risk aversion, investors have flocked to U.S. Treasuries.
At the end of last Friday, the two-year U.S. Treasury yield, which is more sensitive to monetary policy, fell 26.64 basis points to 3.8798%. After the non-agricultural data was released, it fell 26 basis points, diving from 4.1% to 3.8408%, which is 2023. It is the lowest level since May 12, falling 50.35 basis points this week.
The U.S. 10-year benchmark Treasury bond yield fell 18.56 basis points to 3.7904%. When the U.S. non-farm payrolls report was released at 20:30 Beijing time, it plunged from 3.93% to below 3.8%. At 03:51 (near the close of U.S. stocks), it hit a daily low. to 3.7847%, close to the bottom of 3.7815% on December 27, 2023. It was in a state of decline throughout the day, with a cumulative decline of 40.35 basis points this week.
ETFs tracking U.S. Treasury bonds rose 6% this week, as investors bet that the Federal Reserve will be forced to cut interest rates significantly in response to economic weakness in the future, pushing U.S. bond yields sharply lower.
Should you buy U.S. Treasuries now?
Kathryn Kaminski, chief research strategist and portfolio manager of quantitative fund AlphaSimplex Group, said that given the downturn in the stock market and investors are snapping up bonds before U.S. bond yields fall further, the bond market seems to have room to continue to rise. She said the firm's trend-following signals have led them to turn bullish on bonds this month after previously being bearish on Treasuries.
Kaminski said, "People want to lock in high interest rates, which has caused a lot of (bond market) buying pressure, and at the same time there is risk aversion. If the Fed really cuts interest rates at the end of the year, the 10-year U.S. Treasury yield may fall to close to 3%.”
If you need to purchase U.S. bonds, you can easily do so on the uSMART App. The purchase process is as follows:
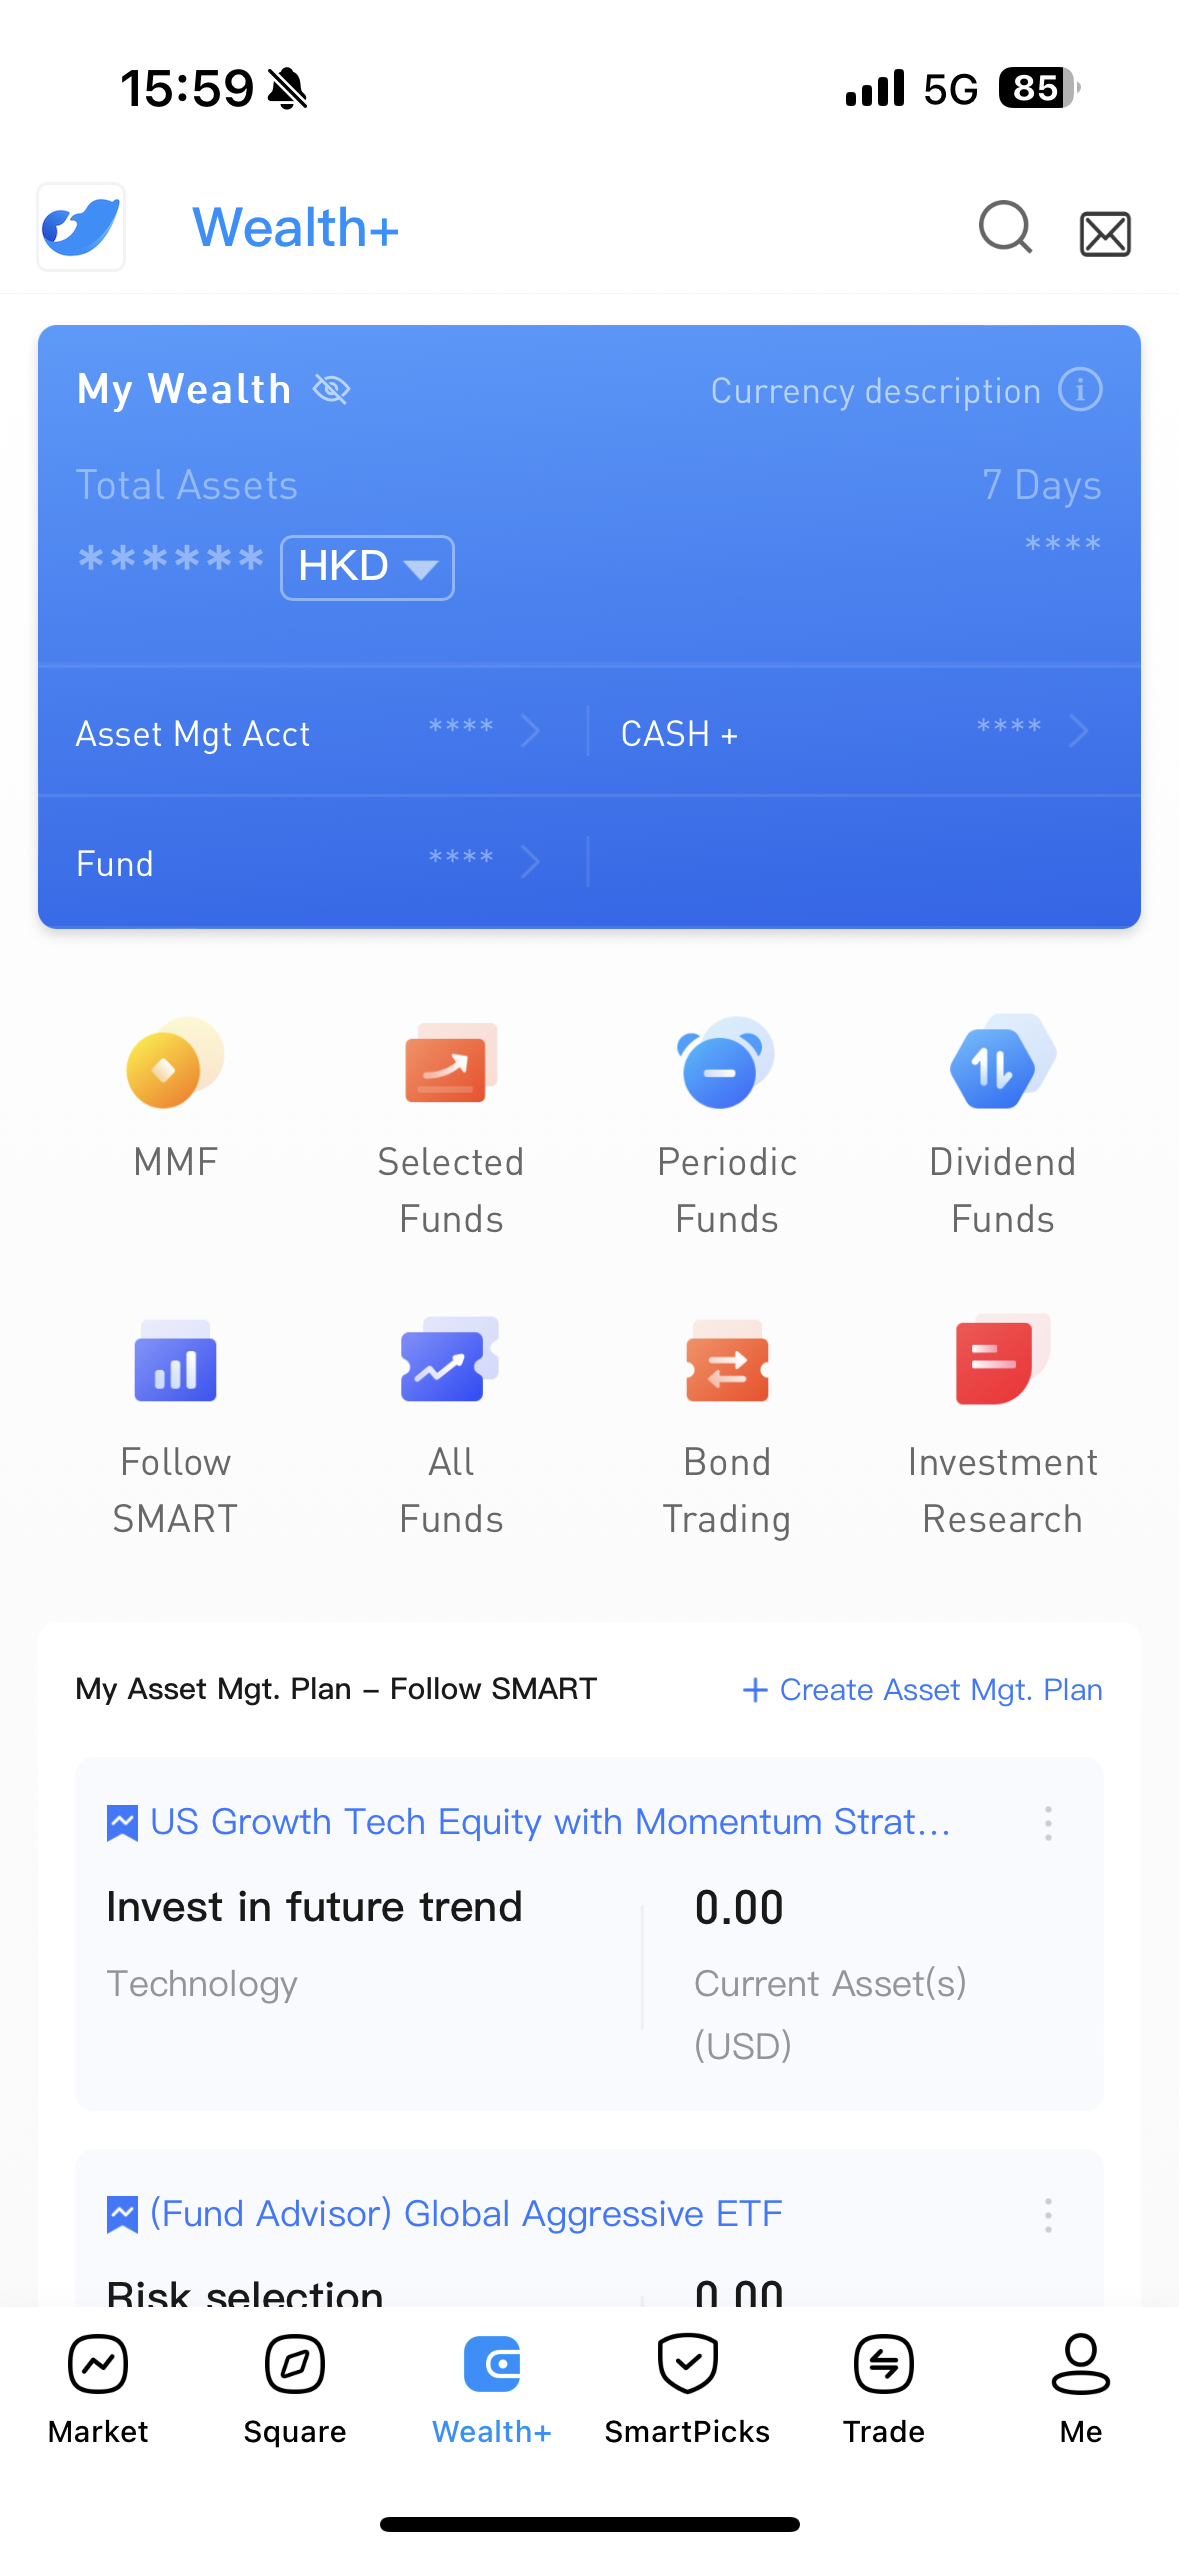
First, open uSMART App, enter the main screen, and click "Wealth+" in the column below.
Next, you will see an option called "Bond Trading", click to enter.
On this page, you can select your favorite U.S. Treasury bonds to purchase. You can enter a specific U.S. Treasury bond code or name through the search box, or browse the list to select the bond of interest. When you find the bond you want to buy, click on the bond to enter the details page. On this page, you can view the basic information of the bond, including maturity date, coupon rate, yield rate, etc.
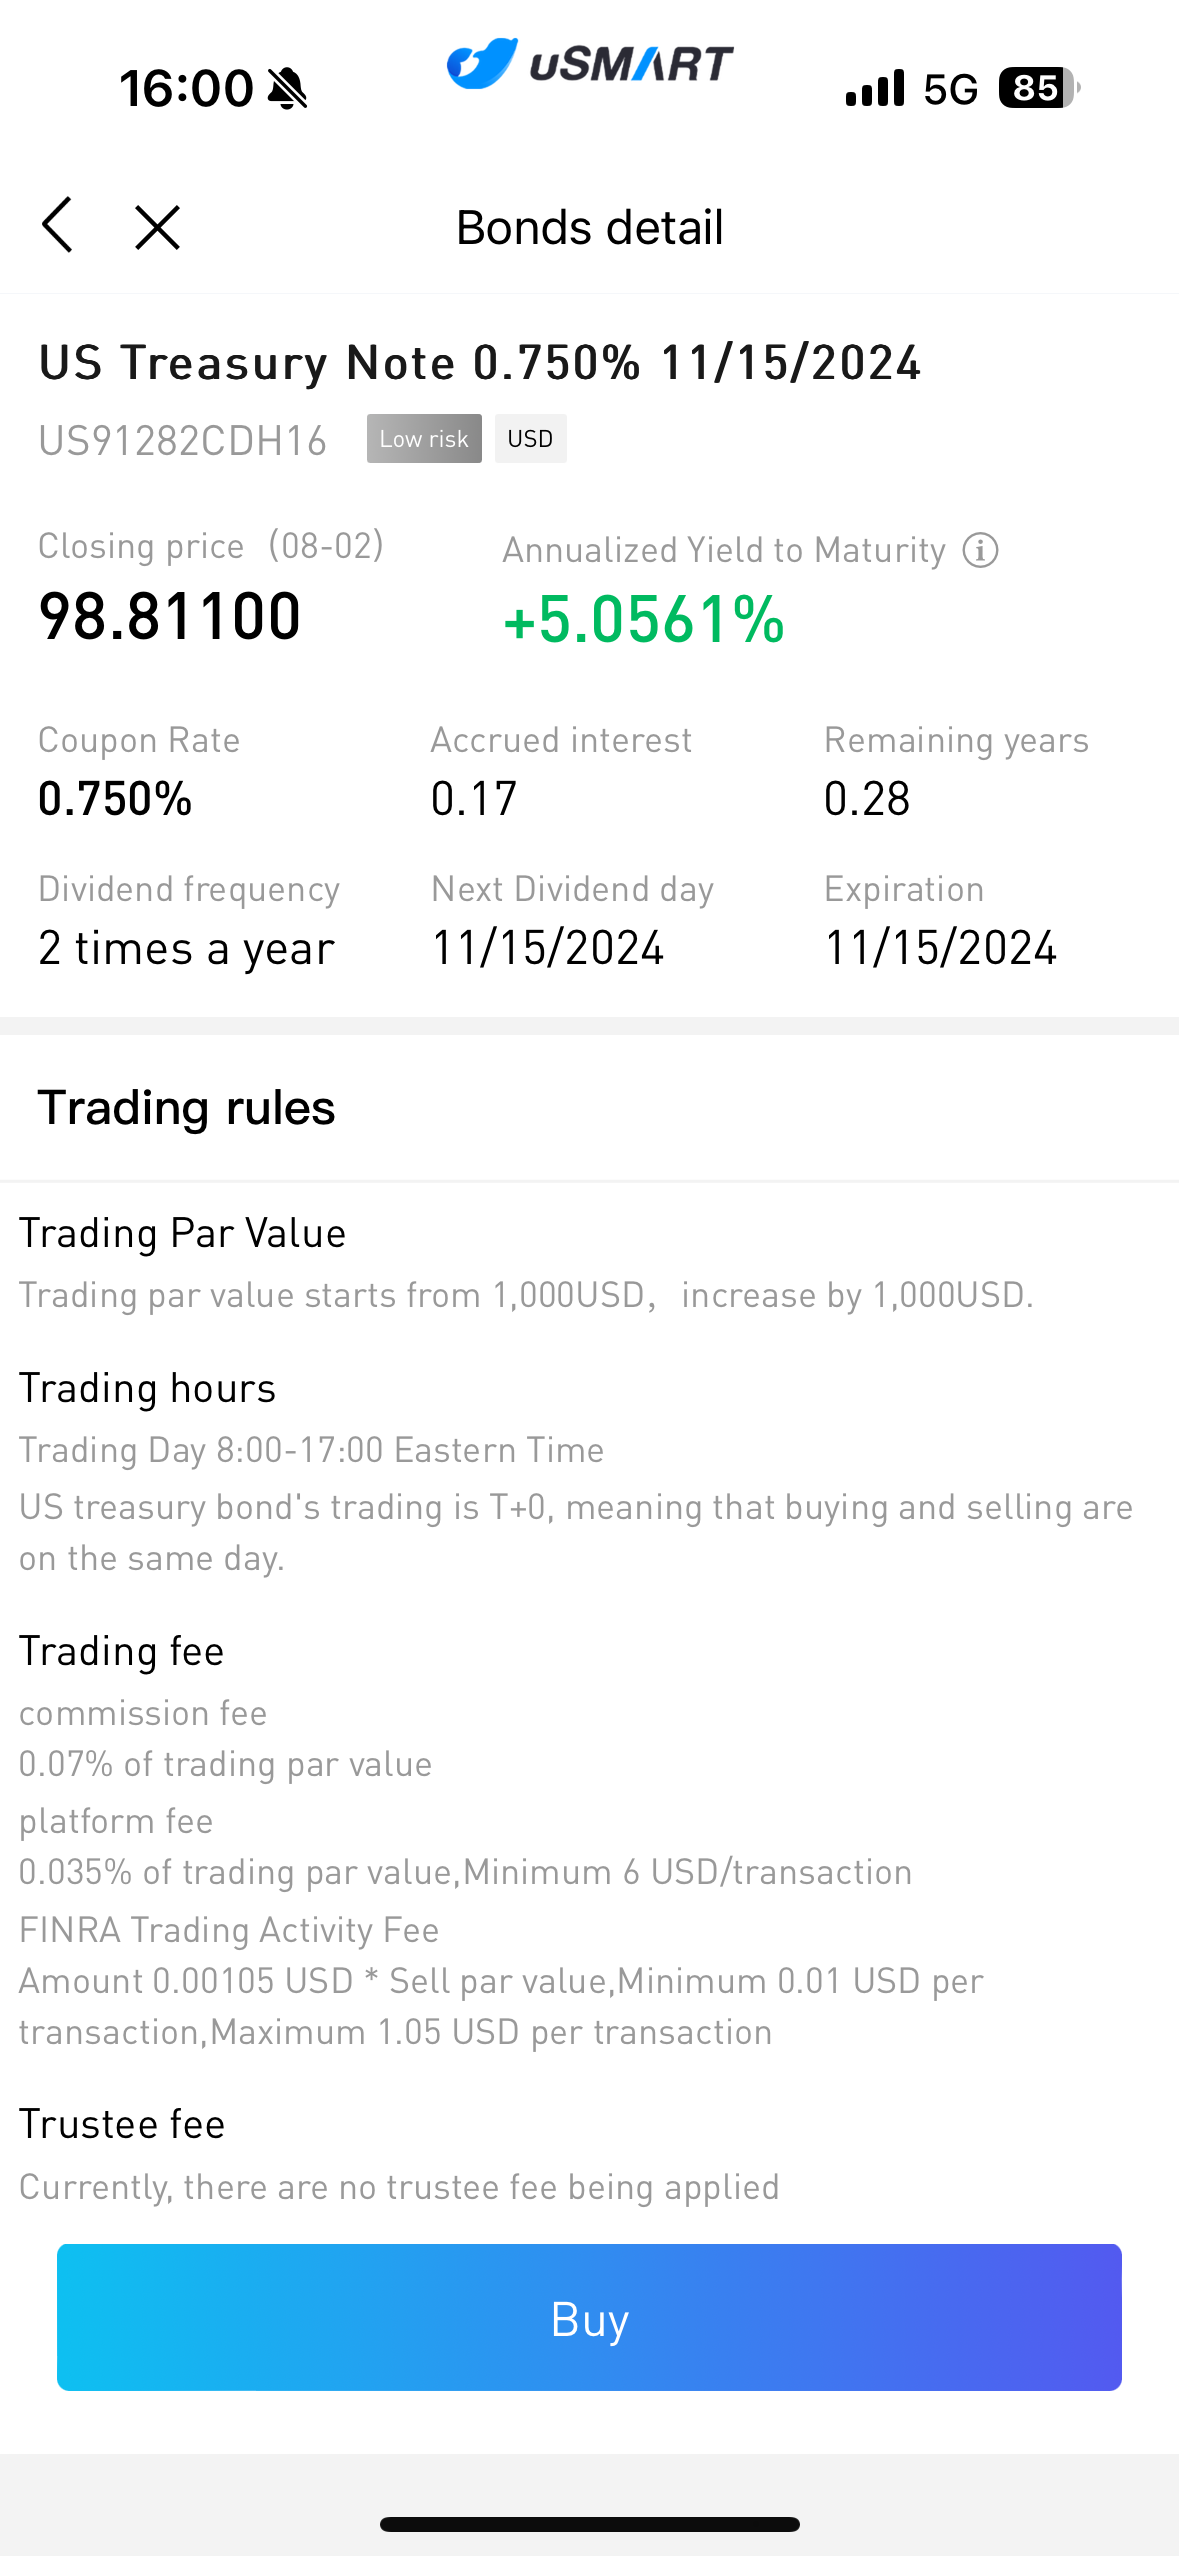
Before trading, you need to complete a risk assessment test that lasts about two minutes to show that you understand the risks of investing in U.S. Treasuries.


More Content


