歷史上,春節前後股市表現如何?
本文來自:蘇寧金融研究院,作者:黃大智
雖然春節假日臨近結束,讓人未免遺憾,但節後的第一個交易日也即將來臨。對於投資者而言,這或許非常值得展望,很多人都期待春節後的股市能有一個新的“開門紅”。
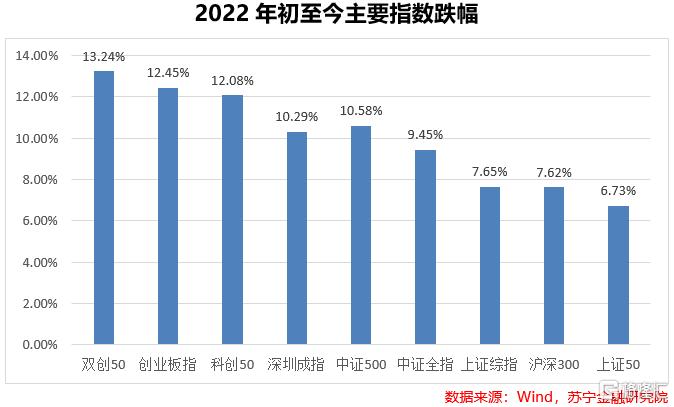
從2022年年初至今,股市第一個月的表現堪稱慘淡,主要指數基本呈單邊下跌狀態,期間短暫的反彈非常之無力。年初至今,中證全指跌超9%。上證綜指下跌超7%。上證50受到大盤權重股的影響,雖有短暫反彈,但也跌超6%。深成指跌近10%。創業板指節前寧德時代業績預告的帶動下雖然有微幅反彈,也跌超12%。代表大盤股的滬深300指數跌超7%。中盤股的中證500跌幅更慘,跌幅近10%。科創50指數及雙創50指數跌幅與創業板相似,跌幅均超12%,其中雙創50指數跌幅最大,年初至今跌超13%。
雖然春節前股市行情的表現着實慘淡,但對於節後的行情,廣大投資者們可以抱有一定的樂觀情緒。
以過去十多年A股市場節前節後的走勢來看,在春節期間,如果沒有重大突發性的利空事件發生,節後第一週均有較高的概率上漲。當然,特例也有很多,例如在2020年,因爲新冠疫情的爆發,雖然節後開市時間一再延遲,股市仍然受到疫情較大影響,主要指數均在2020年3月份出現了“黃金坑”的點位。當這種在假日期間產生較大的利空因素時,在節後的前幾個交易日很一般都會得到比較充分甚至過度的反饋,因此後期行情也會得到比較快速的修復。
以統計數據看,從2000年春節至2020年的春節期間,在節後的一週(以五個交易日計算)中,上證綜指有超過2/3的次數是上漲的,上漲的概率超過65%,平均漲幅也基本都超過了1%。
究其原因,則有幾個方面:
第一是機構資金流入的顯著差別。出於對春節期間消費的預期和需求,節前一般都是投資者需要大量需要資金的時期,除非個別處於比較牛市的行情下,否則多數節前也是公募基金髮行比較預冷的時期。新發基金數量的減少一定程度上導致新入市資金的不足。而在假日結束之後,很多機構也都會加大對於產品的營銷、宣傳力度,吸引新資金入室,由此產生節前節後較大的新資金數量的差別。
第二是對假日期間利空因素的規避。每到節假日,國內A股市場都會有對於“持股過節”還是“持幣過節”的討論與分析,無論結果如何,都會有很多人選擇“持幣過節,會因此導致節前交易量的顯著縮量。因此每到如國慶、春節這樣的長假來臨之前,假日前的股市交易量大幅度降低的特點都十分明顯。當個別行業可能在假期出現較大不確定性時,對交易風險因素規避考慮的影響就更加明顯。
第三則是收益層面,長假前的兩到三個交易日期間,歷來是國債逆回購有較高收益的時期,很多時候一天或兩天國債逆回購的收益率可能是平時的1.5倍以上,甚至高到兩三倍以上也很常見。同時,只要把握好日期,做一天或兩天的國債逆回購,都能享受到八到十天的收益,很多投資者一方面是爲了規避假日期間利空因素的影響,另一方面,用該部分資金做逆回購,確實能夠得到幾倍於“無風險收益率”的收益。長假歸來,這部分的資金重新入市,也是一個很重要的因素。
最後,一般春節後都會很快迎來國內每年最重要的“兩會時間”。每年三月初舉行的兩會都是在緊鄰春節之後,市場在春節這段時間可能會形成一些對兩會的政策預期,一些投資者會選擇提前佈局符合政策預期的板塊和股票。
因此,在綜合這些影響因素之下,在多數情況下,春節後都能迎來比較不錯的“開門紅”行情。
Follow us
Find us on
Facebook,
Twitter ,
Instagram, and
YouTube or frequent updates on all things investing.Have a financial topic you would like to discuss? Head over to the
uSMART Community to share your thoughts and insights about the market! Click the picture below to download and explore uSMART app!

Disclaimers
uSmart Securities Limited (“uSmart”) is based on its internal research and public third party information in preparation of this article. Although uSmart uses its best endeavours to ensure the content of this article is accurate, uSmart does not guarantee the accuracy, timeliness or completeness of the information of this article and is not responsible for any views/opinions/comments in this article. Opinions, forecasts and estimations reflect uSmart’s assessment as of the date of this article and are subject to change. uSmart has no obligation to notify you or anyone of any such changes. You must make independent analysis and judgment on any matters involved in this article. uSmart and any directors, officers, employees or agents of uSmart will not be liable for any loss or damage suffered by any person in reliance on any representation or omission in the content of this article. The content of the article is for reference only and does not constitute any offer, solicitation, recommendation, opinion or guarantee of any securities, virtual assets, financial products or instruments. Regulatory authorities may restrict the trading of virtual asset-related ETFs to only investors who meet specified requirements. Any calculations or images in the article are for illustrative purposes only.
Investment involves risks and the value and income from securities may rise or fall. Past performance is not indicative of future performance. Please carefully consider your personal risk tolerance, and consult independent professional advice if necessary.


