


Economic indicators are tools commonly used in economic research, analysis, planning, and statistics, and are fragments of financial and economic data published by government or private institutions. These statistics are regularly released to the public, and as a result, almost everyone in the financial market relies on this data. Economic indicators often have significant potential to generate trading and price movements when many investors react to this shared information. In this article, we will introduce three common economic indicators: CPI (Consumer Price Index), PPI (Producer Price Index), and PMI (Purchasing Managers' Index).
CPI (Consumer Price Index)
CPI is a commonly used indicator to measure inflation and deflation. It is calculated based on the weighted average of prices for a basket of goods and services. This basket typically includes various categories such as food, housing, transportation, healthcare, education, and entertainment, reflecting the consumption habits and expenditure patterns of typical consumers. The short-term fluctuations in CPI directly reflect the current economic conditions. A larger increase in CPI indicates a more pronounced inflationary situation.
· US CPI:
The US CPI includes seven major categories of goods, namely housing, food, medical care, entertainment, transportation, apparel, and other items.
On Wednesday, April 10th, the US Bureau of Labor Statistics released data showing that the US CPI in March rose by 3.5% year-on-year, exceeding the expected 3.4% and also higher than the previous value of 3.2%. The US CPI in March increased by 0.4% month-on-month, surpassing the expected 0.3% and remaining unchanged from the previous value.
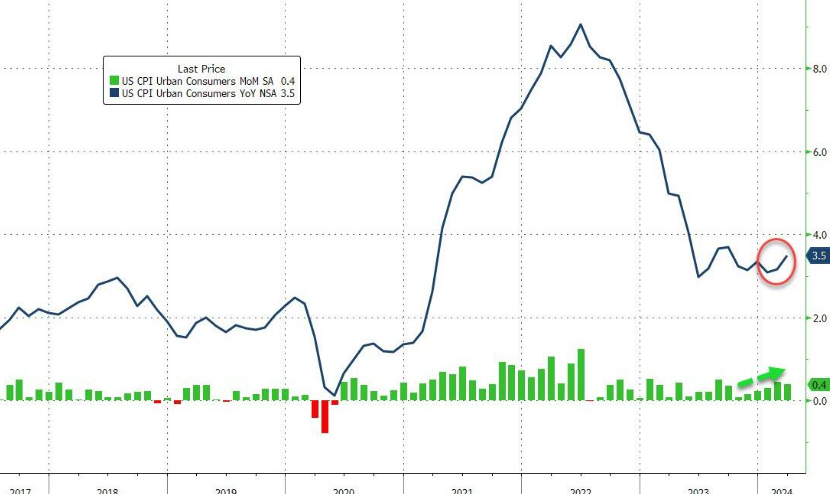 (Data source: U.S. Bureau of Labor Statistics)
The Federal Reserve pays closer attention to core inflation, which excludes food and energy costs. In March, the U.S. core CPI increased by 3.8% year-on-year, surpassing the expected 3.7% and remaining unchanged from the previous value. The month-on-month increase in core CPI for March was 0.4%, higher than the expected 0.3% and also unchanged from the previous value. The same 0.4% increase was observed in January, marking the third consecutive month of exceeding expectations.
The annualized rate of core CPI for the past three months rose from 4.1% to 4.5%, representing the largest increase since May of last year.
· Singapore CPI
The latest release on March 25, 2024, shows that Singapore's CPI increased to 3.4% year-on-year, surpassing the expected 3.3% and also higher than the previous value of 2.9%. The core CPI (excluding accommodation and private road transport) grew by 3.6% year-on-year, also exceeding the estimated 3.4%.
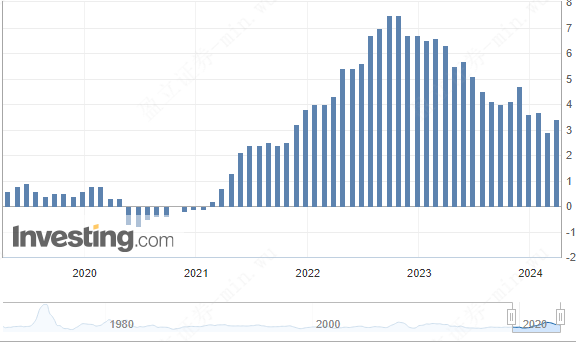 (Data source: Singapore Department of Statistics)
The increase in Singapore's CPI in February was mainly driven by higher prices in food, services, and retail. Although CPI growth slightly exceeded expectations, there are currently no signs indicating that inflation will spiral out of control.
· Hong Kong CPI
Reflecting price changes of goods and services purchased by households from a consumer perspective, the statistical scope of Hong Kong CPI includes food, housing, electricity, gas and water, tobacco and alcohol, clothing, durable goods, miscellaneous goods, transportation, and miscellaneous services. The prices are primarily collected through field visits.
The latest release on March 21, 2024, shows that Hong Kong's CPI increased to 2.10% year-on-year, lower than the expected 2.20%, but higher than the previous value of 1.70%
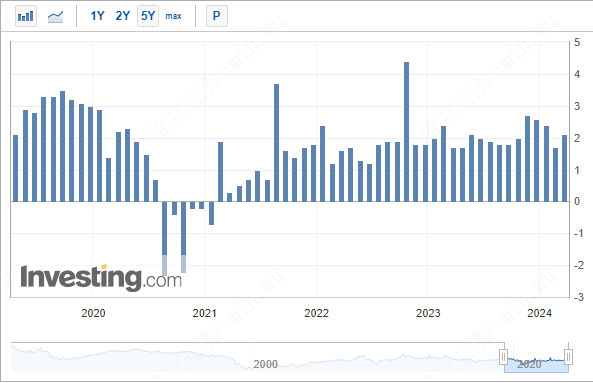
(Data source: Census and statistics department)
During the twelve months ending in February 2024, the overall Consumer Price Index (CPI) increased by an average of 2.1% compared to the same period a year ago. The corresponding increases for Class A, Class B, and Class C CPI were 2.3%, 2.0%, and 2.0% respectively. After excluding the impact of all one-off relief measures by the government, the corresponding increases were 1.5%, 1.5%, 1.5%, and 1.7% respectively.
Looking ahead, inflation is expected to remain moderate in the short term. Although local costs may face some upward pressure as the Hong Kong economy continues to grow, external price pressures should further ease.
PPI(Producer Price Index )
It measures the price changes of outputs (including raw materials and labor services) paid to producers. The weightings of PPI categories vary by country and region but generally cover price changes in three stages: raw materials, intermediate goods, and finished goods. Unlike CPI, PPI focuses on measuring price changes in the production stage, reflecting inflationary pressures and cost fluctuations in production activities. PPI is considered an early indicator of inflationary pressures and can provide some indication of future consumer price changes.
There is a certain correlation between CPI and PPI. Generally, changes in PPI tend to precede changes in CPI. When producers' costs rise, they may pass on these cost increases to consumers, leading to an increase in CPI. Therefore, PPI can be seen as a leading indicator of CPI.
Purchasing Managers' Index (PMI)
It is an economic indicator that measures the level of manufacturing or non-manufacturing economic activity. It provides a quick assessment of economic activity by surveying purchasing managers and collecting and analyzing data on new orders, output, deliveries, inventories, backlogs, employment conditions, supplier delivery times, and other aspects. When the PMI index exceeds 50, it indicates an expansion in the economy, and the higher the value above 50, the better the degree of economic expansion. Conversely, when the PMI index is below 50, it indicates a contraction in the economy, and a lower value indicates a more severe economic downturn.
How to observe CPI, PPI, and PMI?
Taking the United States as an example, in June 2022, the US CPI rose by 1.3% on a month-on-month basis and increased by 9.1% year-on-year, exceeding market expectations. The year-on-year increase was the highest since November 1981. CPI data indicated that the United States was facing serious inflation problems, and central banks of many countries raised interest rates to cope with inflationary pressures.
PPI data showed a sustained upward trend, reflecting the level of economic activity. During the post-pandemic economic recovery period, increased demand gradually improved business production activities. However, if the influence of factors such as raw material prices, supply-demand balance, and currency leads to sustained high PPI levels, it may have adverse effects on economic growth. If the gap between PPI and CPI continues to widen, price transmission will be inevitable, squeezing downstream business profits and affecting various aspects of consumer life.
Compared to PPI, PMI is a more targeted and important indicator of interest to national policymakers and market participants. In June 2022, the US Manufacturing PMI was 52.4, hitting a 23-month low, while the Services PMI was 51.6, hitting a 5-month low. Although the Manufacturing PMI was still above the 50 threshold, indicating expansion, the expansion rate was the slowest since early 2022, and growth in some economic sectors, especially manufacturing activities, slowed significantly. Against the backdrop of high inflation, interest rate hikes, weak demand, and supply chain concerns, companies have lowered their expectations for the future economic outlook, and the continuous deterioration of leading indicators indicates possible economic contraction in the third quarter.
How to trade using CPI, PPI, and PMI?
1. Track indicator data
Obtain timely access to data on CPI, PPI, PMI, and other indicators and pay attention to their release times. These data can usually be obtained from government statistical agencies, economic news websites, or financial data providers.
2. Analyze data and deviations from market expectations
Compare the released indicator data with market expectations. If the data results deviate significantly from market expectations, it may increase market volatility. Such deviations may provide trading opportunities, but careful analysis is required, combined with other technical and fundamental indicators, to make decisions.
3. Cross-validate indicators
Consider data from different indicators comprehensively, such as comparing CPI and PPI data, to obtain a more accurate assessment of the economic situation. Differences between different indicators may provide trading opportunities.
4. Consider the time window
Indicator data released in the short term may trigger market volatility, but for long-term investment strategies, more data and trend analysis are needed. Analyze and make decisions based on yourspecific trading goals and time horizon.
5. Establish a trading strategy
Based on the analysis of indicator data and market conditions, develop an appropriate trading strategy. For example, if PMI data indicates economic expansion, you may consider buying related assets, while if CPI data indicates increasing inflationary pressures, you may adjust your investment portfolio to address inflation risks.
6. Pay attention to risk management
Whether trading based on economic indicators or other factors, it is always important to pay attention to risk management. Setting stop-loss levels, controlling position sizes, and selecting trading strategies that align with your risk tolerance are essential principles.


More Content


