期權市場押注美股將嚴重下跌
隨着緩慢的美股熊市加劇波動,最大的交易商正在頻繁交易股票期權。智通財經獲悉,據Sundial Capital Research的數據,期權市場上規模最大的幾家公司上週買入了逾100億美元的個股看跌期權,創下該羣體的紀錄,也接近有史以來交易商買入的最多紀錄。上週末,標普500指數大幅下跌,VIX波動率指數飆升至32上方,創下6月以來的最高水平。
要從期權市場的任何此類行爲中辨別出明確的信號幾乎是不可能的。看跌期權搶購潮可能是爲了防範股市進一步下跌,也可能是市場試圖利用大規模波動時出現的異常現象。但巨大的交易量再次表明,2022年市場的交易方式已開始與近代史上一些最糟糕的時期相媲美。
Sundial首席研究官Jason Goepfert稱:“如果這些交易只是對少數幾隻股票的相對較少的交易,比如某種龐大複雜的套利或其他策略的一部分,那麼這些數據可能沒有什麼意義。不過,情況似乎並非如此,所以這表明,他們在一場嚴重的、突然的下跌上下了很大的賭注。”
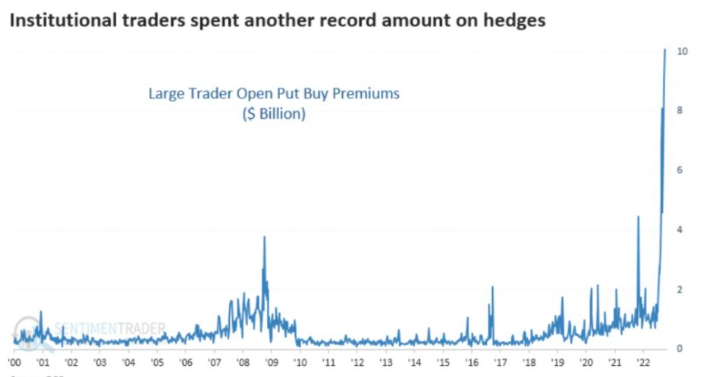
Goepfert承認看漲期權活動也出現激增,但他認爲,即便是期權活動總量"仍遠超以往任何時候"。當Sundial從這些數據中扣除投機活動,並基於市值將其與其他時期進行比較時,最接近的類比是截至2008年10月10日的那一週。在隨後的17個交易日裏,標普500指數較當週的低點上漲了20%,然後在11月底下跌了12%。在此後的100天裏,股市一直沒有觸底。
2022年市場的劇烈波動爲期權市場創造了機會,吸引了使用複雜策略的交易員。這包括結構性交易,即機構投資者利用期權在某些公司事件之前進行押注。
觀察看跌期權和看漲期權的原始成交量只是衡量情緒的一種方式。其他指標並沒有像Sundial彙編的數據那樣糟糕。VIX波動率指數一直維持在30多點左右,比長期平均水平高出約10點,但遠低於其他壓力時期的水平。標普500指數的偏度——衡量看空與看漲合約成本的指標——也遠低於2022年的高點。
儘管標普500指數上週週一和週二上漲了近6%,但隨着時間的推移,交易員越來越擔心美聯儲持續激進的政策可能對經濟有害。美聯儲官員似乎準備在11月舉行的會議上連續第4次加息75個基點,以減緩美國經濟增長速度並降低通脹。
與此同時,來自美國企業界的警告也開始聽起來更加可怕。聯邦快遞公司(FDX.US)上週發佈的一份報告顯示,該公司將很快更新指引,以考慮到經濟形勢走軟的影響,預計經濟形勢將削弱貨運量。與此同時,由於三星電子和AMD(AMD.US)等最近都公佈了令人失望的業績,芯片製造商警告稱,需求一直在減弱。
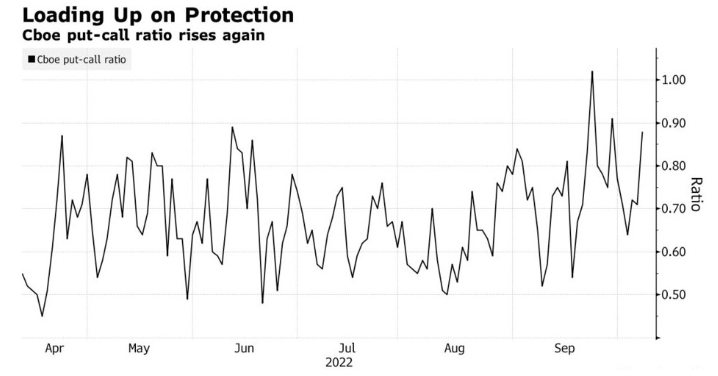
美國股市週一連續第四天下跌。另一個顯示交易員焦慮情緒的跡象是,芝加哥期權交易所股票看跌期權與看漲期權比率在上週初下降後再次飆升。
TD Ameritrade首席交易策略師Shawn Cruz表示:“本週將是非常動盪的一週。正如我們本週聽到美聯儲官員講話的那樣。而銀行的財報季拉開了序幕,這將引發很大的波動。”
Follow us
Find us on
Facebook,
Twitter ,
Instagram, and
YouTube or frequent updates on all things investing.Have a financial topic you would like to discuss? Head over to the
uSMART Community to share your thoughts and insights about the market! Click the picture below to download and explore uSMART app!

Disclaimers
uSmart Securities Limited (“uSmart”) is based on its internal research and public third party information in preparation of this article. Although uSmart uses its best endeavours to ensure the content of this article is accurate, uSmart does not guarantee the accuracy, timeliness or completeness of the information of this article and is not responsible for any views/opinions/comments in this article. Opinions, forecasts and estimations reflect uSmart’s assessment as of the date of this article and are subject to change. uSmart has no obligation to notify you or anyone of any such changes. You must make independent analysis and judgment on any matters involved in this article. uSmart and any directors, officers, employees or agents of uSmart will not be liable for any loss or damage suffered by any person in reliance on any representation or omission in the content of this article. The content of the article is for reference only and does not constitute any offer, solicitation, recommendation, opinion or guarantee of any securities, virtual assets, financial products or instruments. Regulatory authorities may restrict the trading of virtual asset-related ETFs to only investors who meet specified requirements. Any calculations or images in the article are for illustrative purposes only.
Investment involves risks and the value and income from securities may rise or fall. Past performance is not indicative of future performance. Please carefully consider your personal risk tolerance, and consult independent professional advice if necessary.


