博日科技二度闖關港交所:2020年營收飆升7倍,6成收入依賴經銷
據格隆匯新股瞭解,杭州博日科技股份有限公司(以下簡稱“博日科技”)於12月15日再度向港交所遞交上市申請書,這是繼今年6月11日首次遞表失效以來的第二次申請,中金公司爲其獨家保薦人。
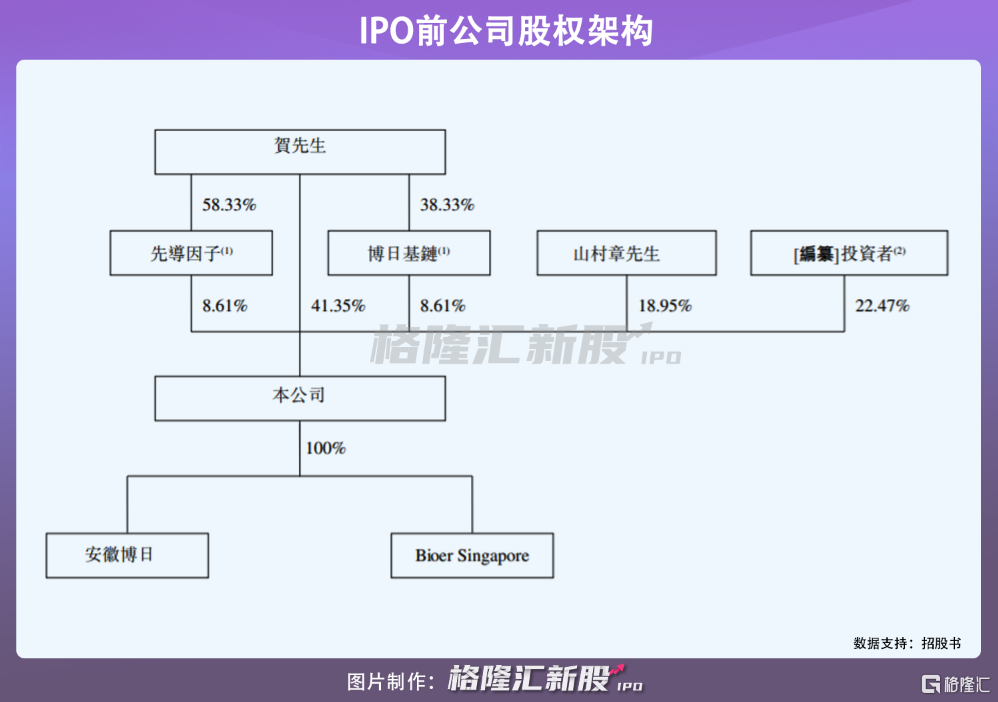
IPO前,賀先生直接持有公司41.35%股份,並通過先導因子、博日基鏈間接控制公司部分股權,合計持股佔比58.58%,爲公司控股股東。此外,山村章先生持股佔比18.95%,其他投資者包括凱普生物科技、中微半導體、華大共贏等。
1
業績高增長或不可持續
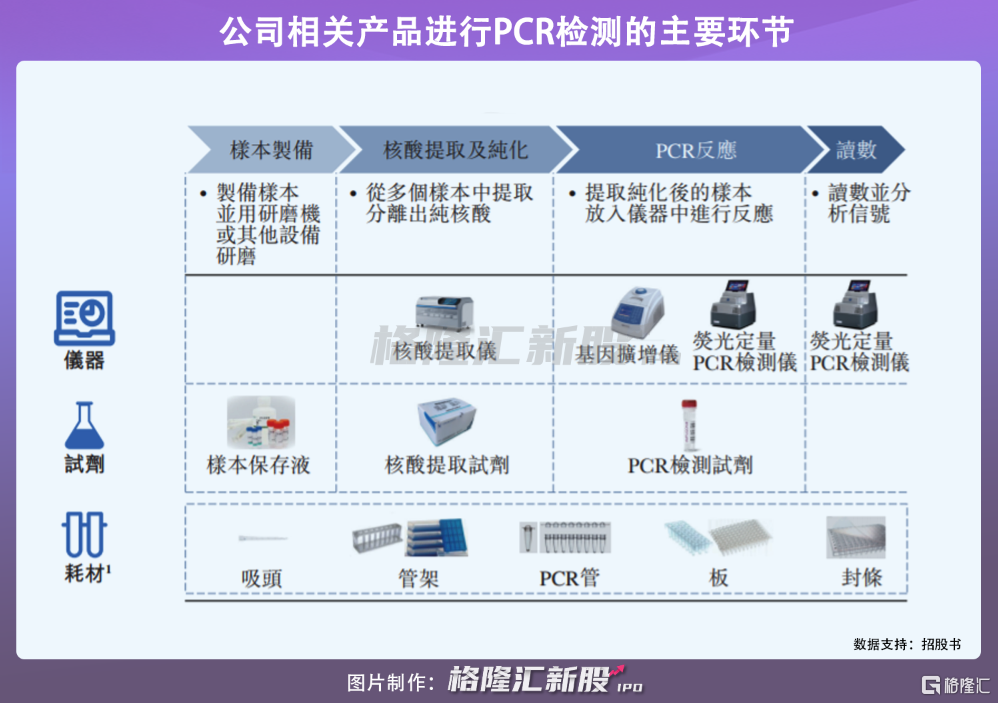
博日科技主要從事設計、開發及銷售三類PCR產品,即儀器、試劑及耗材。根據灼識諮詢報告,公司是中國首家獲得兩款PCR產品((基因擴增儀及熒光定量PCR檢測儀)註冊證書的公司。
PCR檢測是一種涉及將測試樣本中的目標片段放大到足以進行分析的檢測方法。PCR檢測用於臨牀場景以及各種非臨牀場景,如動物疫病檢測、海關檢疫及科學研究。
近年來,全球PCR產品市場規模不斷擴大,由2015年的55億美元增長至2020年的187億美元,複合年增長率爲27.7%,預計2030年將達到388億美元。就中國市場而言,由於2020年新冠疫情爆發,帶動了國內臨牀需求下PCR檢測需求,中國單管核酸檢測能力由每天約1.3百萬份大幅提升至每天約16百萬份,市場規模2020年增長至32億美元。
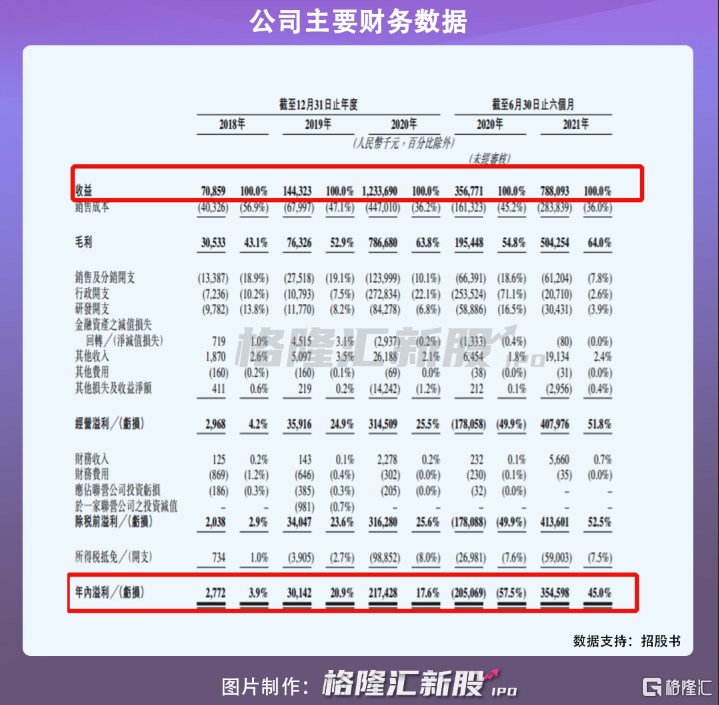
在此背景下,博日科技收入規模大幅增長,2018年-2019年,公司實現收益由7085.9萬元增長至1.44億元,2020年同比增長754.8%至12.34億元;相對應的年內溢利由277.2萬元增長至3014.2萬元,進一步增長至2.17億元。期間內,毛利率則由43.1%上升至63.8%。
2021年上半年,博日科技營收爲7.88億元,較上年同期增長1.2倍;期間內溢利達3.55億元。
對於博日科技來說,疫情帶來的影響,不僅僅只是產品需求及銷量的上升,還有其市場佔有率的提升。灼識諮詢報告顯示,2020年,公司全球銷量在國內PCR設備製造商中排名第一,市場份額爲24.5%,其國內銷量以14.5%的市場份額位居中國PCR設備市場的第三位;若以銷售收益計,博日科技在中國PCR產品市場份額由2019年的1.8%增長至2020年的6%。
不過,因疫情衝擊帶來的短期產品銷售量價齊升,不是行業長期的經營形態。即便國內疫情時有反覆,但重蹈2020年大規模爆發情形不太可能,當疫情紅利褪去之後,隨着產品需求量以及價格的下降,博日科技經營業績飆升未必能持續。
2
上半年經銷商數量減少
招股書顯示,博日科技大部分的產品向經銷商銷售,少部分直接銷售給畜牧業企業、OEM客戶、醫院、獨立臨牀實驗室等終端客戶。
報告期內,公司通過經銷產生的銷售收入分別爲4550.8萬元、9804.5萬元、78951.6萬元、41970.7萬元,分別佔當期收益的64.2%、67.9%、64%、77.3%,一定程度上依賴於經銷商銷售產品。
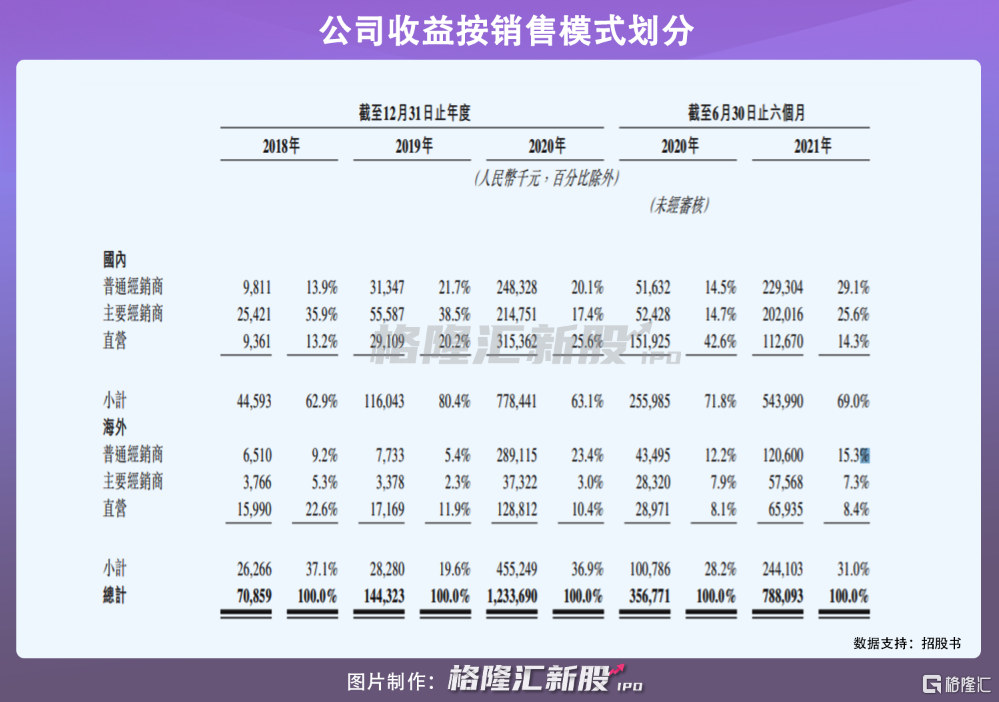
值得注意的是,2018年-2020年,博日科技的經銷商數量不斷增加,由473名增長至1303名。但截至2021年6月,公司經銷商數量較2020年底減少了343名至960名,一定程度上也反映出疫情帶來的紅利不斷褪去,若不斷流失經銷商後未能及時找到或聘用其他經銷商替代,或將對其經營業績產生不利影響。
3
小結
一場新冠疫情,催生了對醫用檢測產品的巨量需求。得益於此,博日科技業績在近一年來呈現爆發性增長。然而因疫情衝擊帶來的短期產品銷售量價齊升並不可持續,隨着疫情的常態化發展及有效控制,公司未來業績高增長可能會回落。
Follow us
Find us on
Facebook,
Twitter ,
Instagram, and
YouTube or frequent updates on all things investing.Have a financial topic you would like to discuss? Head over to the
uSMART Community to share your thoughts and insights about the market! Click the picture below to download and explore uSMART app!

Disclaimers
uSmart Securities Limited (“uSmart”) is based on its internal research and public third party information in preparation of this article. Although uSmart uses its best endeavours to ensure the content of this article is accurate, uSmart does not guarantee the accuracy, timeliness or completeness of the information of this article and is not responsible for any views/opinions/comments in this article. Opinions, forecasts and estimations reflect uSmart’s assessment as of the date of this article and are subject to change. uSmart has no obligation to notify you or anyone of any such changes. You must make independent analysis and judgment on any matters involved in this article. uSmart and any directors, officers, employees or agents of uSmart will not be liable for any loss or damage suffered by any person in reliance on any representation or omission in the content of this article. The content of the article is for reference only and does not constitute any offer, solicitation, recommendation, opinion or guarantee of any securities, virtual assets, financial products or instruments. Regulatory authorities may restrict the trading of virtual asset-related ETFs to only investors who meet specified requirements. Any calculations or images in the article are for illustrative purposes only.
Investment involves risks and the value and income from securities may rise or fall. Past performance is not indicative of future performance. Please carefully consider your personal risk tolerance, and consult independent professional advice if necessary.


