曲線熊平後再怎麼變?
本文來自格隆匯專欄:國君固收覃漢,作者:覃漢,石玲玲
8月份以來國債和國開債期限利差持續收窄,利率曲線扁平化,國債、國開債10-2年期限利差分別下降至2009年以來23%分位和41%分位,本輪曲線平坦主要是由於長端利率窄幅震盪、短端利率持續上行導致。目前,期限利差已經連續兩個月收窄,但短期還是沒看到觸發曲線陡峭化的催化劑。
利率曲線形態變化,取決於長短端利率的相對變化,長端利率通常由經濟基本面決定,短端利率通常由貨幣政策決定。牛市利差收窄,通常是由於長端利率下行更快;牛市利差走闊通常由短端利率下行更快;熊市利差收窄,主要由短端利率上行更快導致;熊市利差走闊,通常是由於長端利率上行更快。
從歷史規律來看,利率無論是進入上行通道還是下行通道,曲線形態基本都是先陡峭、後平坦。當債市走牛時,經濟衰退信號出現,貨幣放水,短端利率迅速下行,“牛陡”出現,隨着經濟底部確認,長端利率逐步反應,利率曲線開始“牛平”;當債市開始走熊,經濟復甦預期出現,長端利率上行更快,隨後經過“熊陡”充分調整,貨幣政策收緊帶動短端利率上行,逐步進入“熊平”。
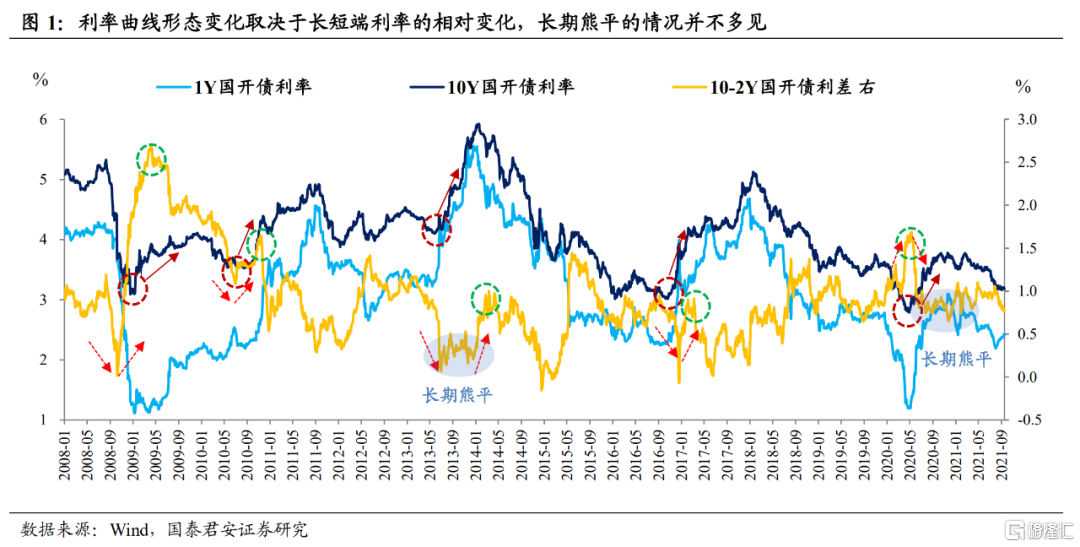
2020年5-11月是相對反常的階段,債市由牛轉熊,利率曲線基本直接熊平,期限利差從一個極端迅速走向了另一個極端,後續熊平的時間長達半年,直到2020年11月永煤事件放水,利率曲線才重新開始陡峭。
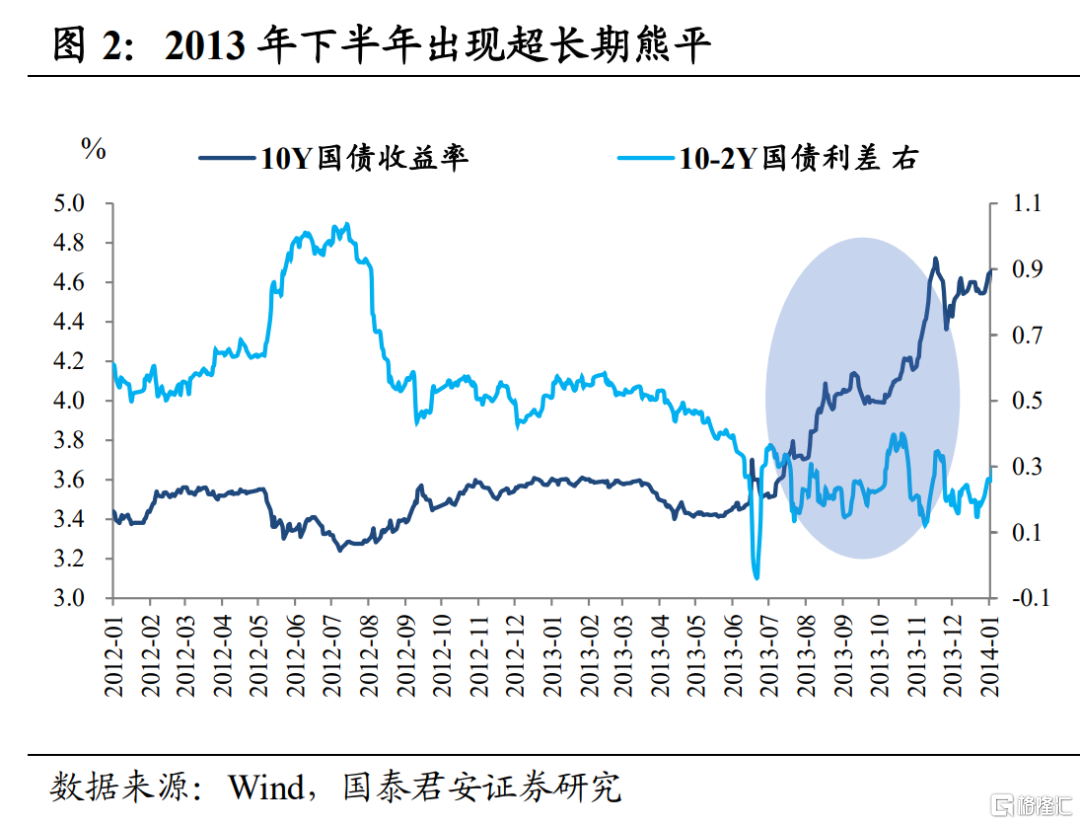
從歷史經驗來看,僅2013年符合曲線先熊平、後熊陡的情況,且熊平持續時間長達半年。2013年下半年經濟復甦跡象初顯,但由於“620錢荒”央行遲遲沒有出手,短端利率極度敏感,帶動期限利差收窄;隨後8月3日央行二季度貨幣政策執行報告,公佈3年期中票到期續作被凍結,疊加7月工業增加值(9.7%)超預期回升,雙重利空衝擊,市場對貨幣政策持續收緊的擔憂升溫,利差繼續收窄;等到9-10月基本面繼續改善、而央行公開市場操作卻時常缺位時,貨幣政策的“捉摸不定”的擔憂幾乎達到頂峯,期限利差也繼續維持在低位。
熊市初期利率曲線長期平坦化,基本有兩種情況:①基本面向好跡象出現、但尚不明朗,市場難以準確把握經濟和政策方向,慣性思維下,長端利率窄幅震盪,但資金預期持續惡化,短端利率大幅上行。②經濟復甦趨勢出現,貨幣政策提前收緊,從極度寬鬆走向中性偏緊,並長期維持緊平衡,長端利率上行,但短端上行幅度更大。
在傳統的逆週期調節框架中,貨幣政策會等到基本面給出明確復甦信號後,再轉而收緊,因此在復甦初期,貨幣政策還是會維持相對平穩。所以,在傳統框架下,經濟復甦初期,長端利率上行、但短端利率平穩,利率曲線大多先熊陡、再熊平。
2020年5-11月長端利率上行和期限利差收窄幾乎同步發生,熊平持續了相當長一段時間,大致屬於上述提到的第二種情況,而2013年下半年的熊平屬於第一種情況。
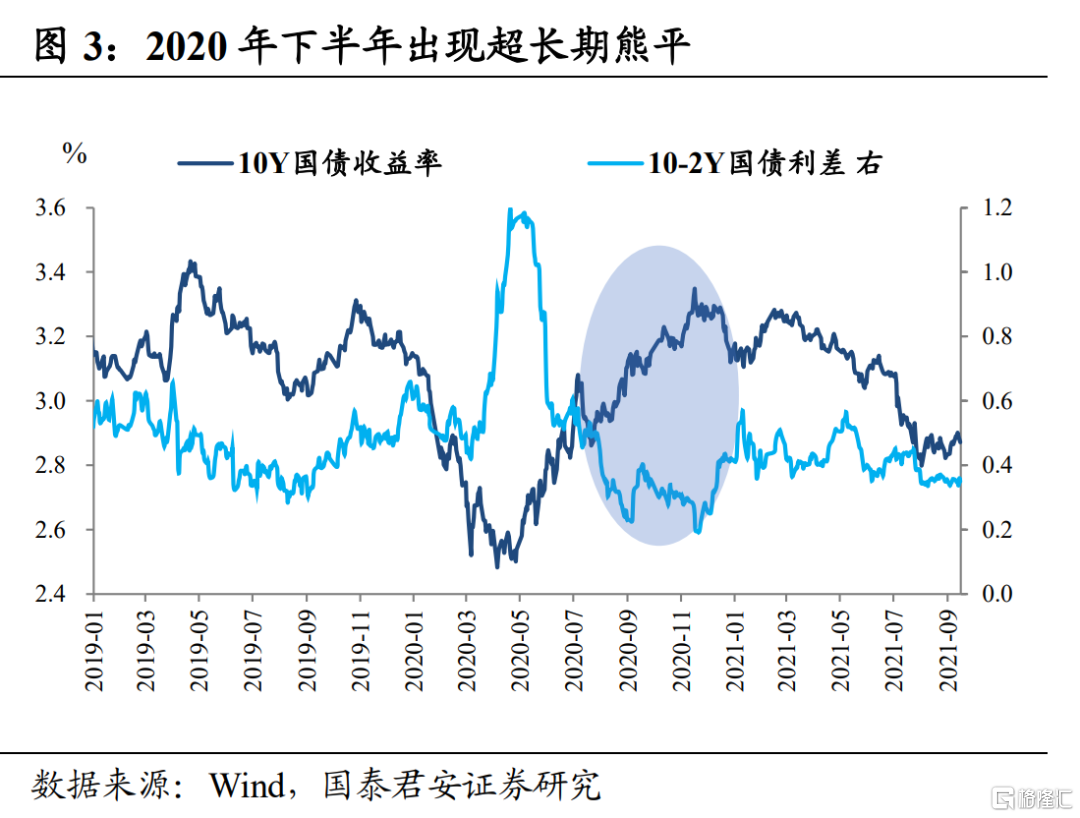
貨幣政策從“逆週期調節”轉變爲“跨週期調節”,過去通過曲線調控的思路發生轉變。疫情影響下,經濟衰退和復甦週期持續時間都更短,2020年5-11月長端利率還在按照以往的思維緩慢上行;但貨幣政策提前收緊,讓市場有經濟過熱的“錯覺”,資金面持續緊平衡,短端利率上行幅度更大,並持續到11月永煤放水,明確的寬鬆信號出現,纔打破“熊平”狀態。
落腳當下,2021年春節以來,債市大致經歷了“牛平-牛陡-熊平-牛陡-牛平-熊平”,每個階段的持續時間都不長,但7月下旬以來的熊平已經持續近2個月,一方面是經濟從復甦轉向新一輪衰退,但加速下行信號未明確出現,長端利率窄幅震盪;另一方面,7月份全面降準後,央行未再釋放明確寬鬆信號,只是維持日常流動性供需平衡,資金預期從“極度樂觀”走向“緊平衡”,貨幣政策信號不明朗,短端利率上行。整體而言,市場對經濟和貨幣政策預期的不對稱,導致近兩個月期限利差持續壓縮。
我們認爲,在基本面和貨幣政策拐點都不明朗的情況下,下一階段,央行的首要任務還是維持資金日常供需平衡,短端利率鬆綁的時間窗口尚未到來,曲線扁平化可能還會持續。至於利率曲線何時重新陡峭,我們認爲,可能會像2020年5-11月份一樣,曲線在長期平坦中醞釀機會,等到基本面和貨幣寬鬆給出明確信號後,才重新迎來牛陡。
Follow us
Find us on
Facebook,
Twitter ,
Instagram, and
YouTube or frequent updates on all things investing.Have a financial topic you would like to discuss? Head over to the
uSMART Community to share your thoughts and insights about the market! Click the picture below to download and explore uSMART app!

Disclaimers
uSmart Securities Limited (“uSmart”) is based on its internal research and public third party information in preparation of this article. Although uSmart uses its best endeavours to ensure the content of this article is accurate, uSmart does not guarantee the accuracy, timeliness or completeness of the information of this article and is not responsible for any views/opinions/comments in this article. Opinions, forecasts and estimations reflect uSmart’s assessment as of the date of this article and are subject to change. uSmart has no obligation to notify you or anyone of any such changes. You must make independent analysis and judgment on any matters involved in this article. uSmart and any directors, officers, employees or agents of uSmart will not be liable for any loss or damage suffered by any person in reliance on any representation or omission in the content of this article. The content of the article is for reference only and does not constitute any offer, solicitation, recommendation, opinion or guarantee of any securities, virtual assets, financial products or instruments. Regulatory authorities may restrict the trading of virtual asset-related ETFs to only investors who meet specified requirements. Any calculations or images in the article are for illustrative purposes only.
Investment involves risks and the value and income from securities may rise or fall. Past performance is not indicative of future performance. Please carefully consider your personal risk tolerance, and consult independent professional advice if necessary.


