You are browsing the Hong Kong website, Regulated by Hong Kong SFC (CE number: BJA907). Investment is risky and you must be cautious when entering the market.
全球排名14位,中國創新能力到底有多強?
格隆匯 06-03 13:11

本文來自:上海證券報,作者:宋薇萍

中國的創新能力處於什麼水平?作為創新發展的重要平台和力量,國家高新區創新能力如何?科創板對創新的影響力如何?

剛剛,2021浦江創新論壇成果發佈會舉行,會上連發4份權威報吿,對中國的創新能力進行了全面分析和展望。

《國家創新指數報吿2020》顯示,中國國家創新指數綜合排名世界第14位,比上年提升1位,是唯一進入前15位的發展中國家。

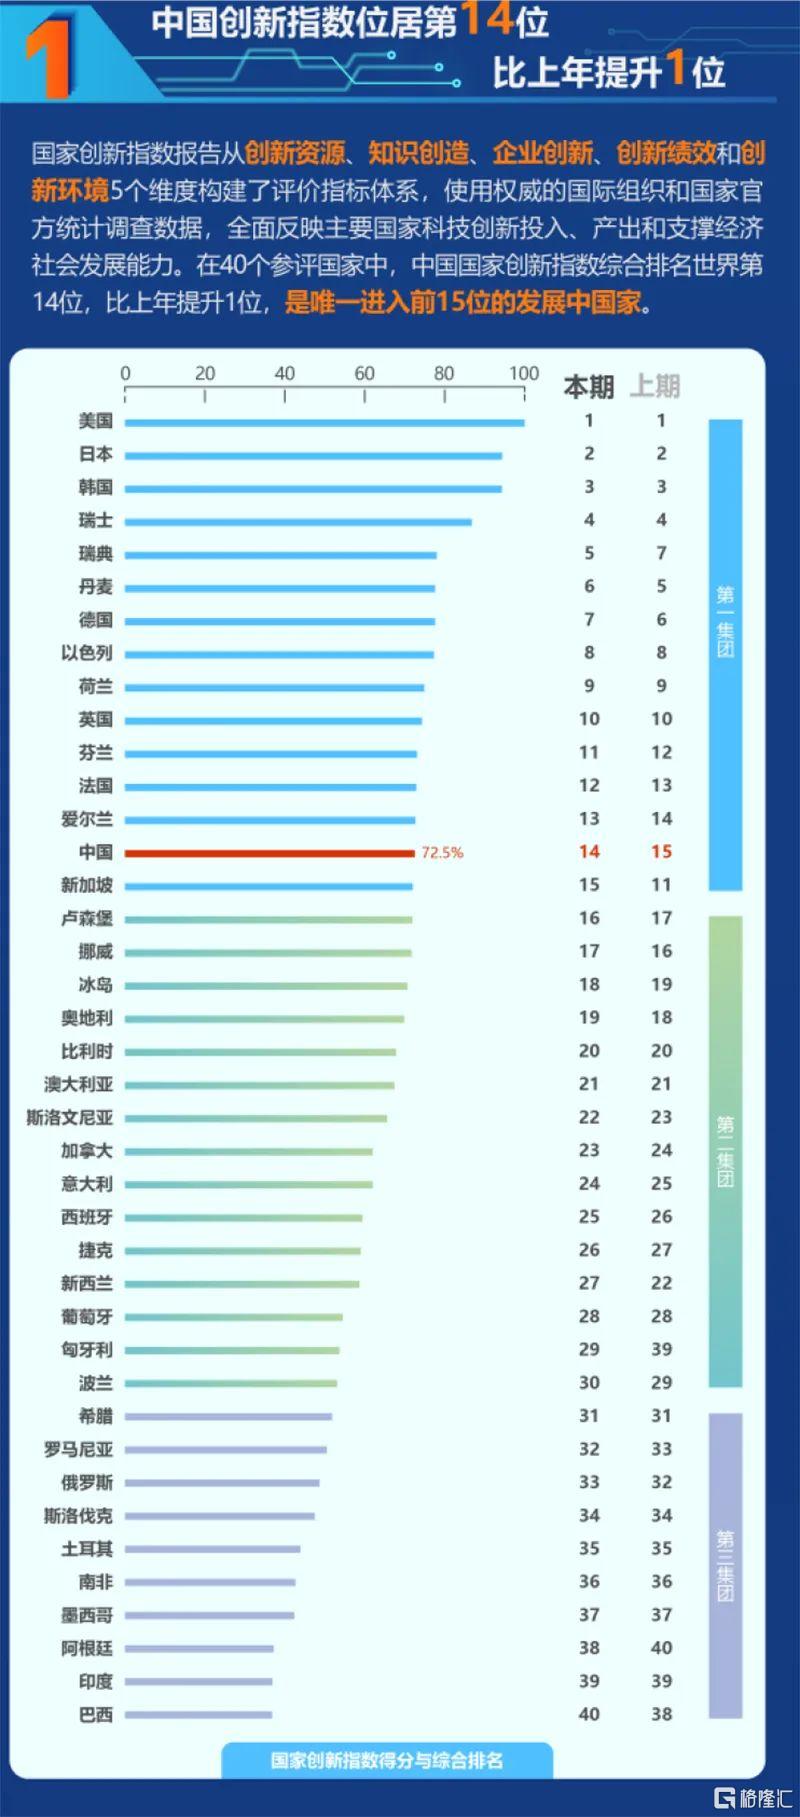
從具體得分看,中國國家創新指數得分為72.5分,比上年提高2.6分,與英國、芬蘭、法國、愛爾蘭等排名10~13位國家間的差距為0.2~1.8分,差距進一步縮小。

中國創新能力穩步上升,大幅超越處於同一經濟發展水平的國家。2018年中國人均GDP為9771美元,在世界40個主要國家中僅高於印度、南非、巴西、土耳其和墨西哥。但是,中國創新指數得分已接近人均GDP在5萬美元左右的歐洲國家,是唯一一個R&D投入強度超過2%的中高收入階段國家。

中國科學技術發展戰略研究院副院長劉冬梅説,目前,世界創新格局基本穩定,創新版圖重心逐漸東移,中國“創新資源”和“創新環境”分指數穩步提升,“創新績效”仍需改善。

創新績效是一國開展創新活動所產生的成果和影響的集中表現。中國“創新績效”排名第15位,與上年持平。知識密集型產業增加值佔世界比重排名世界第2位;高技術產業出口佔製造業出口的比重為31%,排名第3位;勞動生產率和綜合能耗產出率與創新型國家還有較大差距,分別排名第38位和第36位。

作為創新發展的重要載體,國家高新區創新能力如何?

《國家高新區創新能力評價報吿(2020)》給出答案:國家高新區創新能力全面提升。

報吿顯示,“十三五”以來國家高新區創新經濟實力顯著增強,主要科技經濟指標全面增長,成為國民經濟高質量發展的重要戰略支撐。

2019年,全國169家國家高新區園區生產總值(GDP)達到12.14萬億元,GDP總額相當於全國GDP的12.3%,比2015年提高了0.1個百分點。2019年,國家高新區企業R&D經費內部支出與園區生產總值(GDP)比例為6.8%,是全國R&D經費支出與GDP比例的3倍多,超額完成了“十三五”規劃發展目標。

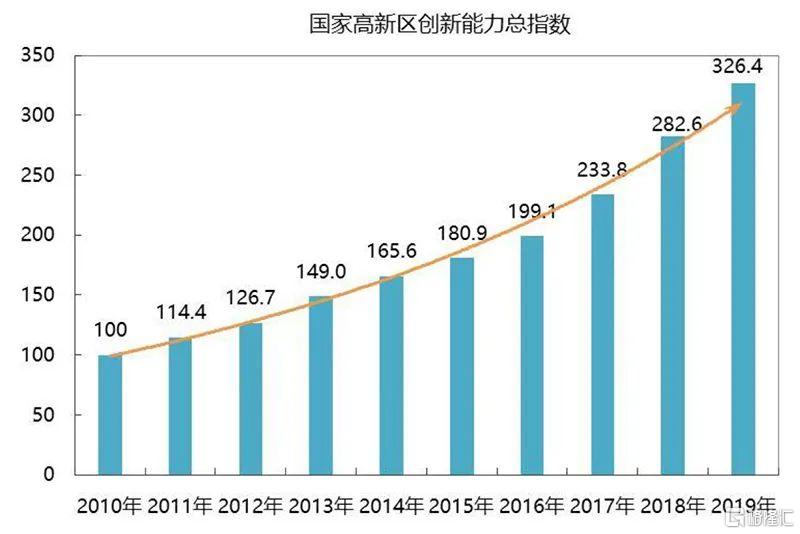
報吿指出,2019年國家高新區創新能力總指數快速增長,創新能力全面提升,向創新發展示範區邁出堅實步伐。

從基期2010年開始到2019年,國家高新區創新能力總指數從100點提升至326.4點,累計增長了226.4點,平均每年增長25.2點。2019年總指數較上年增長43.8點,指數增速達到了15.5%。

科技部火炬高技術產業開發中心副主任張木表示,“十四五”時期,國家高新區將站在歷史的重要關口,機遇前所未有,挑戰也前所未有,需要圍繞自立自強的創新能力建設展開系列關鍵議題研究,並開展相關專項行動。

作為資本市場助力科技創新的重要平台,科創板已經成為A股上市主戰場。

一份題為《上海科技金融生態年度觀察2020》的報吿指出,2020年科創板成為A股上市主戰場。

上海市科學學研究所科技創業研究室副研究員金愛民説:回顧“十三五”特別是2018年,上海企業到境外市場上市的數量和規模其實佔比非常大,可以達到三分之二。但隨着科創板的上市,逐漸扭轉了這個局面,2020年上市的企業數量,整體融資規模超過了境外市場,所以説國內的A股市場成為上海企業上市的首選。

此外,《2021“理想之城”——全球青年科學家調查》顯示,上海對於全球青年科學家的吸引力格外突出。

關於青年科學家未來遷移願望的問卷調查結果顯示,在20座全球科技創新中心城市中,上海對於全球青年科學家的吸引力排名第四位,居中國城市之首,充分體現了上海的科技創新開放窗口和網絡樞紐地位。特別是對於全球30歲以下青年科學家的吸引力,上海位居所有20座城市之首。

Follow us
Find us on Facebook, Twitter , Instagram, and YouTube or frequent updates on all things investing.Have a financial topic you would like to discuss? Head over to the uSMART Community to share your thoughts and insights about the market! Click the picture below to download and explore uSMART app!
Disclaimers
uSmart Securities Limited (“uSmart”) is based on its internal research and public third party information in preparation of this article. Although uSmart uses its best endeavours to ensure the content of this article is accurate, uSmart does not guarantee the accuracy, timeliness or completeness of the information of this article and is not responsible for any views/opinions/comments in this article. Opinions, forecasts and estimations reflect uSmart’s assessment as of the date of this article and are subject to change. uSmart has no obligation to notify you or anyone of any such changes. You must make independent analysis and judgment on any matters involved in this article. uSmart and any directors, officers, employees or agents of uSmart will not be liable for any loss or damage suffered by any person in reliance on any representation or omission in the content of this article. The content of the article is for reference only and does not constitute any offer, solicitation, recommendation, opinion or guarantee of any securities, virtual assets, financial products or instruments. Regulatory authorities may restrict the trading of virtual asset-related ETFs to only investors who meet specified requirements. Any calculations or images in the article are for illustrative purposes only.
Investment involves risks and the value and income from securities may rise or fall. Past performance is not indicative of future performance. Please carefully consider your personal risk tolerance, and consult independent professional advice if necessary.
uSMART
Wealth Growth Made Easy
Open Account