You are browsing the Hong Kong website, Regulated by Hong Kong SFC (CE number: BJA907). Investment is risky and you must be cautious when entering the market.
全球排名14位,中国创新能力到底有多强?
格隆汇 06-03 13:11

本文来自:上海证券报,作者:宋薇萍

中国的创新能力处于什么水平?作为创新发展的重要平台和力量,国家高新区创新能力如何?科创板对创新的影响力如何?

刚刚,2021浦江创新论坛成果发布会举行,会上连发4份权威报告,对中国的创新能力进行了全面分析和展望。

《国家创新指数报告2020》显示,中国国家创新指数综合排名世界第14位,比上年提升1位,是唯一进入前15位的发展中国家。

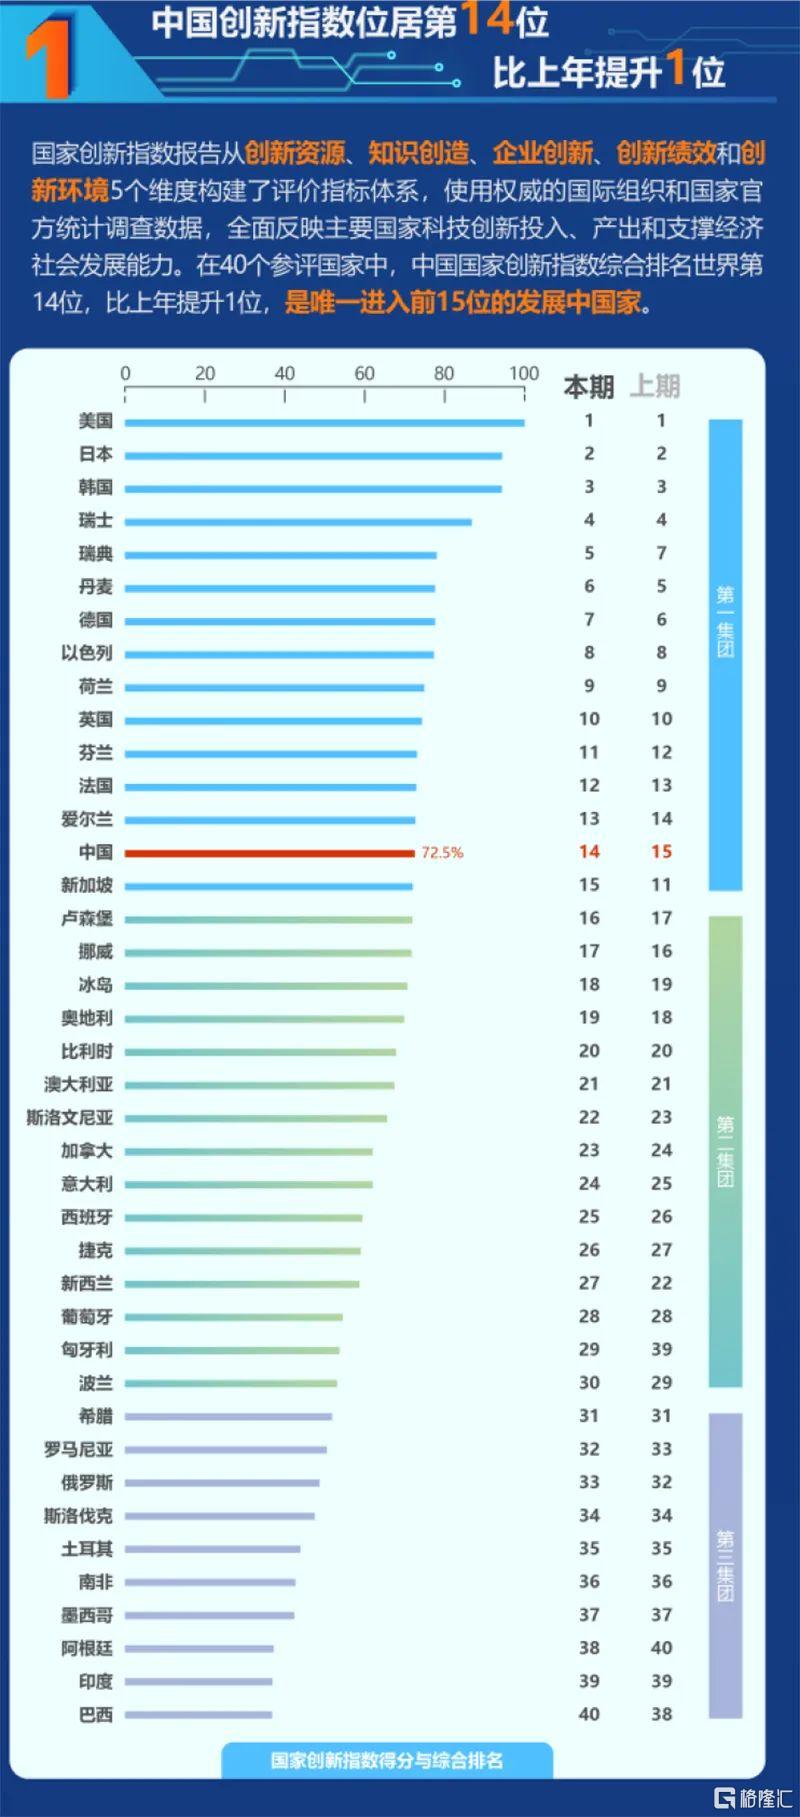
从具体得分看,中国国家创新指数得分为72.5分,比上年提高2.6分,与英国、芬兰、法国、爱尔兰等排名10~13位国家间的差距为0.2~1.8分,差距进一步缩小。

中国创新能力稳步上升,大幅超越处于同一经济发展水平的国家。2018年中国人均GDP为9771美元,在世界40个主要国家中仅高于印度、南非、巴西、土耳其和墨西哥。但是,中国创新指数得分已接近人均GDP在5万美元左右的欧洲国家,是唯一一个R&D投入强度超过2%的中高收入阶段国家。

中国科学技术发展战略研究院副院长刘冬梅说,目前,世界创新格局基本稳定,创新版图重心逐渐东移,中国“创新资源”和“创新环境”分指数稳步提升,“创新绩效”仍需改善。

创新绩效是一国开展创新活动所产生的成果和影响的集中表现。中国“创新绩效”排名第15位,与上年持平。知识密集型产业增加值占世界比重排名世界第2位;高技术产业出口占制造业出口的比重为31%,排名第3位;劳动生产率和综合能耗产出率与创新型国家还有较大差距,分别排名第38位和第36位。

作为创新发展的重要载体,国家高新区创新能力如何?

《国家高新区创新能力评价报告(2020)》给出答案:国家高新区创新能力全面提升。

报告显示,“十三五”以来国家高新区创新经济实力显著增强,主要科技经济指标全面增长,成为国民经济高质量发展的重要战略支撑。

2019年,全国169家国家高新区园区生产总值(GDP)达到12.14万亿元,GDP总额相当于全国GDP的12.3%,比2015年提高了0.1个百分点。2019年,国家高新区企业R&D经费内部支出与园区生产总值(GDP)比例为6.8%,是全国R&D经费支出与GDP比例的3倍多,超额完成了“十三五”规划发展目标。

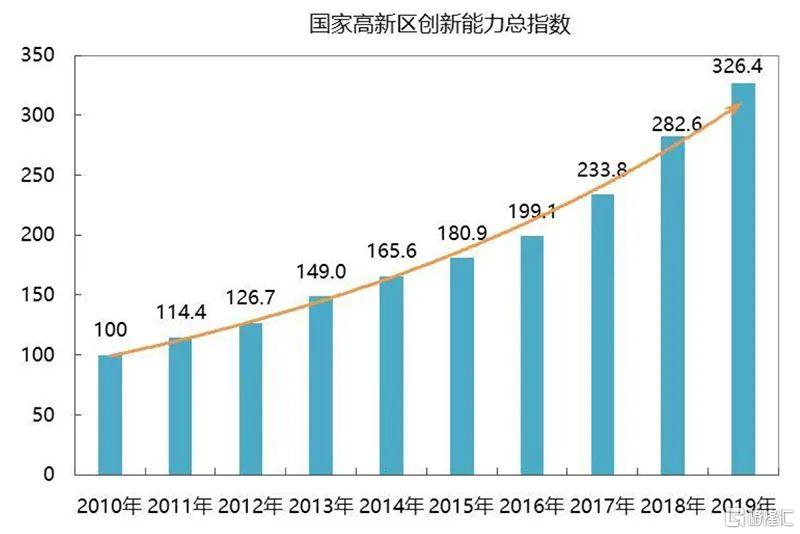
报告指出,2019年国家高新区创新能力总指数快速增长,创新能力全面提升,向创新发展示范区迈出坚实步伐。

从基期2010年开始到2019年,国家高新区创新能力总指数从100点提升至326.4点,累计增长了226.4点,平均每年增长25.2点。2019年总指数较上年增长43.8点,指数增速达到了15.5%。

科技部火炬高技术产业开发中心副主任张木表示,“十四五”时期,国家高新区将站在历史的重要关口,机遇前所未有,挑战也前所未有,需要围绕自立自强的创新能力建设展开系列关键议题研究,并开展相关专项行动。

作为资本市场助力科技创新的重要平台,科创板已经成为A股上市主战场。

一份题为《上海科技金融生态年度观察2020》的报告指出,2020年科创板成为A股上市主战场。

上海市科学学研究所科技创业研究室副研究员金爱民说:回顾“十三五”特别是2018年,上海企业到境外市场上市的数量和规模其实占比非常大,可以达到三分之二。但随着科创板的上市,逐渐扭转了这个局面,2020年上市的企业数量,整体融资规模超过了境外市场,所以说国内的A股市场成为上海企业上市的首选。

此外,《2021“理想之城”——全球青年科学家调查》显示,上海对于全球青年科学家的吸引力格外突出。

关于青年科学家未来迁移愿望的问卷调查结果显示,在20座全球科技创新中心城市中,上海对于全球青年科学家的吸引力排名第四位,居中国城市之首,充分体现了上海的科技创新开放窗口和网络枢纽地位。特别是对于全球30岁以下青年科学家的吸引力,上海位居所有20座城市之首。

Follow us
Find us on Facebook, Twitter , Instagram, and YouTube or frequent updates on all things investing.Have a financial topic you would like to discuss? Head over to the uSMART Community to share your thoughts and insights about the market! Click the picture below to download and explore uSMART app!
Disclaimers
uSmart Securities Limited (“uSmart”) is based on its internal research and public third party information in preparation of this article. Although uSmart uses its best endeavours to ensure the content of this article is accurate, uSmart does not guarantee the accuracy, timeliness or completeness of the information of this article and is not responsible for any views/opinions/comments in this article. Opinions, forecasts and estimations reflect uSmart’s assessment as of the date of this article and are subject to change. uSmart has no obligation to notify you or anyone of any such changes. You must make independent analysis and judgment on any matters involved in this article. uSmart and any directors, officers, employees or agents of uSmart will not be liable for any loss or damage suffered by any person in reliance on any representation or omission in the content of this article. The content of the article is for reference only and does not constitute any offer, solicitation, recommendation, opinion or guarantee of any securities, virtual assets, financial products or instruments. Regulatory authorities may restrict the trading of virtual asset-related ETFs to only investors who meet specified requirements. Any calculations or images in the article are for illustrative purposes only.
Investment involves risks and the value and income from securities may rise or fall. Past performance is not indicative of future performance. Please carefully consider your personal risk tolerance, and consult independent professional advice if necessary.
uSMART
Wealth Growth Made Easy
Open Account