京东 ( JD.O ) 3Q FY19业绩点评:亮眼的Q3业绩vs保守的Q4指引,从京东季报再看下沉市场
机构:光大证券
评级:增持
◆公司公布2019三季度业绩并上调全年盈利指引
公司Q3实现净收入1348亿元,同比增长28.7%;其中净产品收入1189亿元,同比增长27%;净服务收入160亿元,同比增长47%。报告期毛利率14.9%,同比下滑0.5pct。公司Q3实现Non-GAAP净利30.9亿元,上调全年Non-GAAP净利指引至98-105亿。公司在活跃用户规模方面的表现同样超预期,Q3年度活跃用户数3.34亿,同比增长9.6%,环比新增用户1300万。
◆亮眼的Q3业绩:下沉市场用户线上消费习惯正迅速进化
公司Q3业绩超预期。从公司层面看,京东在下沉市场的布局终于获得进一步突破;从行业层面看,我们认为下沉市场用户消费习惯正迅速进化:
1/下沉市场用户线上消费习惯迅速进化。拼多多用低客单价商品以及微信社交关系打开了下沉用户线上购物的大门,然而随着电商平台对下沉用户的不断引导,低线用户线上消费习惯开始迅速向高客单价商品进化。下沉市场缺位的线下渠道为高定位/高客单价商品带来了更大的空间。
2/京东平台的品牌效应使得其获益于下沉市场高客单价需求增长。京东通过多年打造的平台品牌形象使其在一定程度上获益于下沉市场高客单价需求的增长。公司自营收入增速的大幅提升以及整体毛利率的小幅下滑,均说明公司正受益于低线城市3C/家电等高客单价品类增长红利。
3/三季度部分消费电子旗舰产品集中上市拉动公司业绩超预期。iPhone11系列在9月上市发售,根据京东自营9月旗舰机销量排行榜,iPhone11单月通过京东自营渠道实现销售57.1万台,若按平均单价9000元计算则对应营收51.4亿元,相当于公司三季度营收3.8%。
◆保守的Q4指引:下沉市场的终极对决即将展开
公司业绩指引对应Q4Non-GAAP净利润为-1.4至5.6亿元。我们认为公司保守的业绩指引意味着两点:
1/下沉市场的争夺依然激烈:通过“双十一”“双十二”等购物节进行大规模的用户补贴和激励仍然是主流平台改善留存的重要手段。期待公司在与其他平台的竞争中逐步提高营销效率,以实现盈利水平的继续改善。
2/下沉市场订单密度降低将对履约费用率造成一定压力。低线城市由于订单密度较低,对于自建物流的京东来说,履约费用率短期存在重新上升的可能性。
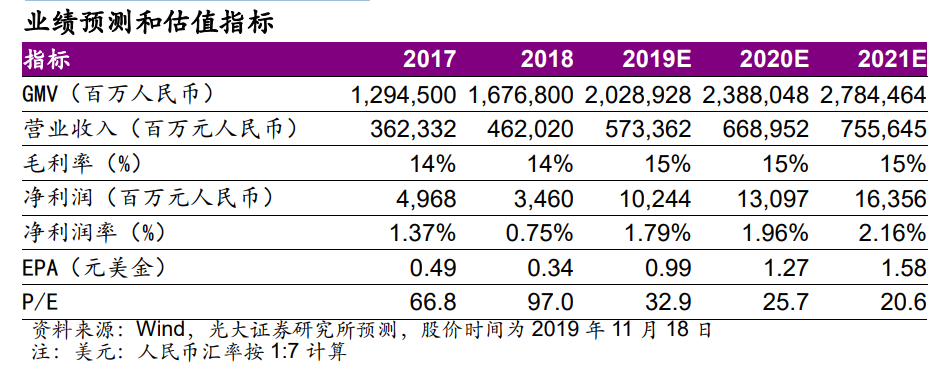
◆盈利预测、估值与评级
公司从三季度开始受益于下沉市场用户高客单价需求的崛起,我们预计 Q4开始随着“京喜”下沉导向产品的上线,公司将进一步加大对低线市场用户的获取;建议观察公司下沉市场用户获取效率及履约费用率提升情况。我们上调公司2019年Non-GAAP净利润为102亿元,维持公司2020-2021年Non-GAAP净利润为131/164亿元,对应EPA分别为0.99/1.27/1.58美元,维持“增持”评级。
◆风险提示:
1/宏观消费需求超预期恶化;2/公司拼购等新业务发展低于预期;3/公司成本及费用控制效果低于预期。
Follow us
Find us on
Facebook,
Twitter ,
Instagram, and
YouTube or frequent updates on all things investing.Have a financial topic you would like to discuss? Head over to the
uSMART Community to share your thoughts and insights about the market! Click the picture below to download and explore uSMART app!

Disclaimers
uSmart Securities Limited (“uSmart”) is based on its internal research and public third party information in preparation of this article. Although uSmart uses its best endeavours to ensure the content of this article is accurate, uSmart does not guarantee the accuracy, timeliness or completeness of the information of this article and is not responsible for any views/opinions/comments in this article. Opinions, forecasts and estimations reflect uSmart’s assessment as of the date of this article and are subject to change. uSmart has no obligation to notify you or anyone of any such changes. You must make independent analysis and judgment on any matters involved in this article. uSmart and any directors, officers, employees or agents of uSmart will not be liable for any loss or damage suffered by any person in reliance on any representation or omission in the content of this article. The content of the article is for reference only and does not constitute any offer, solicitation, recommendation, opinion or guarantee of any securities, virtual assets, financial products or instruments. Regulatory authorities may restrict the trading of virtual asset-related ETFs to only investors who meet specified requirements. Any calculations or images in the article are for illustrative purposes only.
Investment involves risks and the value and income from securities may rise or fall. Past performance is not indicative of future performance. Please carefully consider your personal risk tolerance, and consult independent professional advice if necessary.


