財報解剖 | 是什麼讓音樂天王Spotify暴漲
作者 | Gin
數據支持 | 勾股大數據(www.gogudata.com)

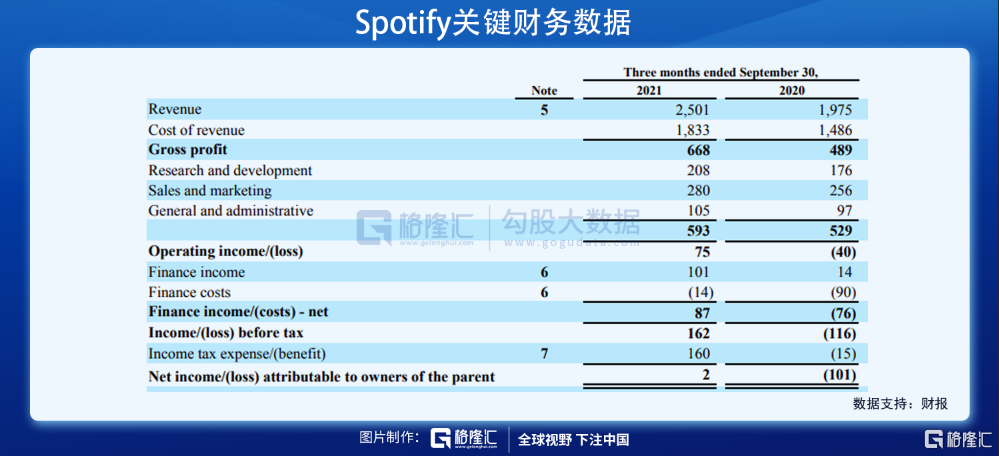
音樂流媒體龍頭Spotify發佈新一季財報,營收25億歐元,同比增長26.6%,預期24.5億歐元;EPS-0.41歐元,預期的-0.21歐元。按道理來說這樣的財報只能說一般,營收基本是in line,EPS和預期有較大的差距。但是這份財報卻讓這個500億美金市值的巨頭暴漲8.3%,其中到底是有什麼名堂?
關鍵點有以下幾個:
(1)對於高增長的公司市場向來對虧損的容忍度比較高,只要不出現太離譜的情況(比如持續燒錢卻沒有相應的效果),過往亞馬遜、Sea、Shopify等等明星股都是明證,所以Spotify的EPS比預期差很多並不是太大的事,需要結合其他核心指標來看;
(2)毛利率從去年同期24.8%提升至26.7%,大約2個百分點的幅度是很好的信號,並且這個數據超過了上一季給出的指引的最高值(24.4%-26.4%),這強力提振了市場信心;
(3)結合營收in line,毛利率超預期,EPS不及預期,也就意味着成本端開支超出了不少。那麼燒的錢有效果嗎?從結果來看市場是認賬的,主要在於MAU(月活躍用戶)這個關鍵指標——同比提升19%,達到3.81億,預期3.80億,基本是inline,微微超一點。這當然還不足以強勢拉昇8%,接着往下看;
(4)FCF(自由現金流)9900萬美元,超過預期9340萬美元。熟悉亞馬遜的朋友們都知道FCF意味着什麼(這也就是巴老爺子重大誤判的地方,導致錯失亞馬遜),這個數據非常solid;
(5)最後,預期的指引很強。管理層指引Q4營收達到25.4億-26.8億歐元,此前市場預期25.8億美元,也就是這個指引超出預期不少。結果管理層以前給的指引來看,說話還是比較靠譜的,所以市場也用真金白銀進行了表態。
接下來進一步細看:
Spotify的商業模式比較好理解,分爲兩塊收入:一塊是訂閱會員收入,一塊是廣告。
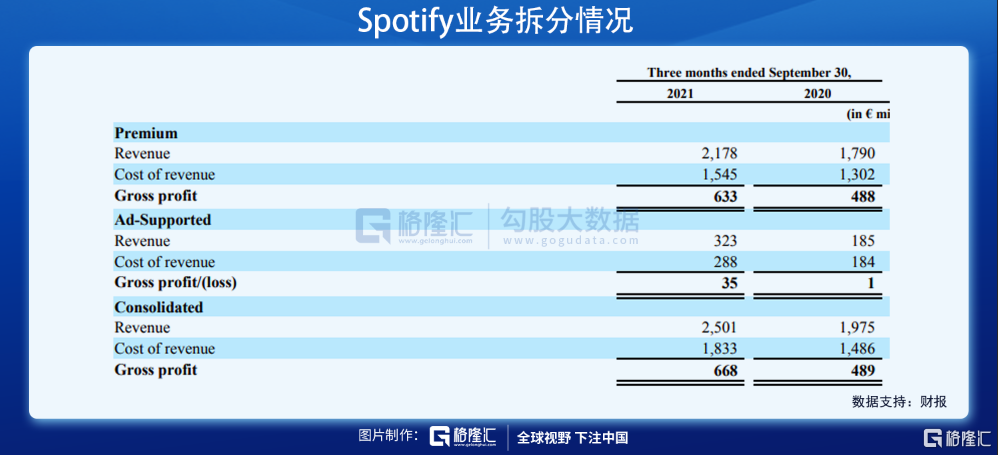
Premium訂閱會員收入佔大頭,Q3營收21.78億歐元,同比增長21.7%,佔營收87.1%,去年同期佔比90.6%,有比較明顯的下降。這意味着廣告收入的佔比提升,對於Spotify來說是相對不錯的信號——訂閱會員天花板有限,需要打開第二增長曲線。訂閱會員Q3毛利率29%,相較去年同期27%也有提升,經營持續向好。
廣告收入3.23億歐元,同比大增74.6%,佔營收12.9%,去年同期佔比9.4%,相比有較大幅度的提升。值得一提的是Spotify的廣告收入增速比Facebook、Snap等大幅領先,這表明廣告商有向其平臺的遷移的趨勢——Spotify的平臺價值已毋庸置疑,廣告收入的天花板在於給合作商提供多高的ROI,往後我們再對這裏詳細分析。
接下來看成本端:
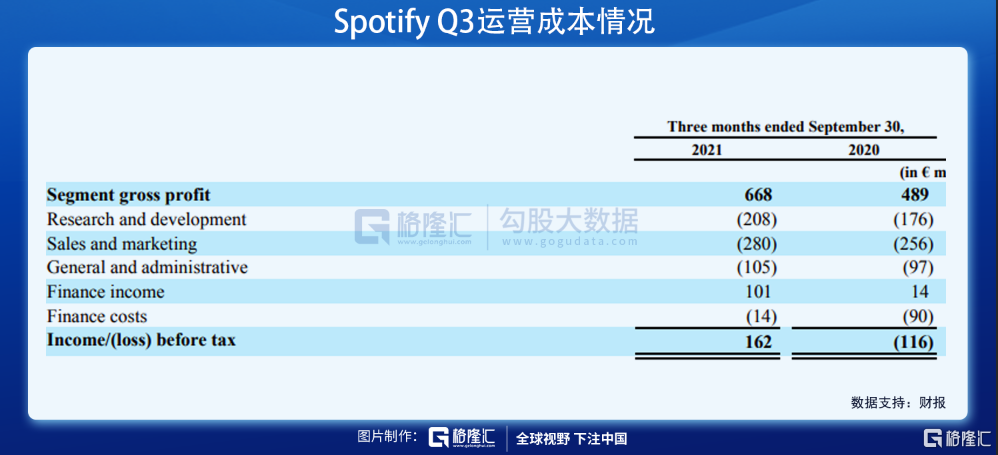
SpotifyQ3整體運營成本5.93億美元,同比增長12.1%,相較於營收26.6%的增速來說少了很多,背後反映的是邊際收益和效能的放大。大體來說是比較好的信號,但是另一方面也要注意到成本增速和營收增速都不算很高,這也就是說Spotify有正在走向成熟的趨勢,高成長的屬性相應減弱,而這往往意味着估值迴歸。
拆分一下來看,和其他成長型消費互聯網公司類似,Spotify的營銷成本佔比很高,Q3佔總成本47.2%(去年同期48.4%),不過好在同比增長9%,和上文分析一樣,這個增速相比於營收和MAU增速低不少,意味着渠道邊際效能的提高。研發成本2.08億美元,同比增長18%,佔總成本比重35%;綜合管理成本1.05億美元,同比增長8%,佔總成本17.7%,都屬於健康的水平。
SpotifyQ3經營利潤7500萬美元,同比扭虧爲盈,但這個利潤率水平目前還比較低。從估值來看,目前市值約523億美元,對應今年預期P/S約4.7x,對於不到30%增速,利潤率水平偏低(終局淨利率可能不到10%)的公司來說,這個估值是比較高的。支撐的邏輯在於音樂流媒體這個賽道有比較長的坡,而Spotify有一定的競爭壁壘,有可能復刻奈飛的故事。
現在這個位置我們傾向保持相對中性態度,因爲畢竟還有蘋果、亞馬遜等一衆巨頭在不斷投入,Spotify有可能面臨其他垂類龍頭如攜程(看17-19年美團對其衝擊)一樣的局面。
注:本文由美股研習社團隊原創,轉載請註明出處,謝謝!
Follow us
Find us on
Facebook,
Twitter ,
Instagram, and
YouTube or frequent updates on all things investing.Have a financial topic you would like to discuss? Head over to the
uSMART Community to share your thoughts and insights about the market! Click the picture below to download and explore uSMART app!

Disclaimers
uSmart Securities Limited (“uSmart”) is based on its internal research and public third party information in preparation of this article. Although uSmart uses its best endeavours to ensure the content of this article is accurate, uSmart does not guarantee the accuracy, timeliness or completeness of the information of this article and is not responsible for any views/opinions/comments in this article. Opinions, forecasts and estimations reflect uSmart’s assessment as of the date of this article and are subject to change. uSmart has no obligation to notify you or anyone of any such changes. You must make independent analysis and judgment on any matters involved in this article. uSmart and any directors, officers, employees or agents of uSmart will not be liable for any loss or damage suffered by any person in reliance on any representation or omission in the content of this article. The content of the article is for reference only and does not constitute any offer, solicitation, recommendation, opinion or guarantee of any securities, virtual assets, financial products or instruments. Regulatory authorities may restrict the trading of virtual asset-related ETFs to only investors who meet specified requirements. Any calculations or images in the article are for illustrative purposes only.
Investment involves risks and the value and income from securities may rise or fall. Past performance is not indicative of future performance. Please carefully consider your personal risk tolerance, and consult independent professional advice if necessary.


