康龙化成飙涨11%,泰格医药、药明康德涨超7%!CRO行业究竟发生了什么?
今日,医药生物板块市场表现火热,医疗ETF大涨4%,其中CRO板块最为亮眼,康龙化成涨近11%,昭衍新药一字板封涨,泰格医药、美迪西、药石科技、药明康德均涨超7%。同时,港股康龙化成涨近10%,药明康德大涨5%。
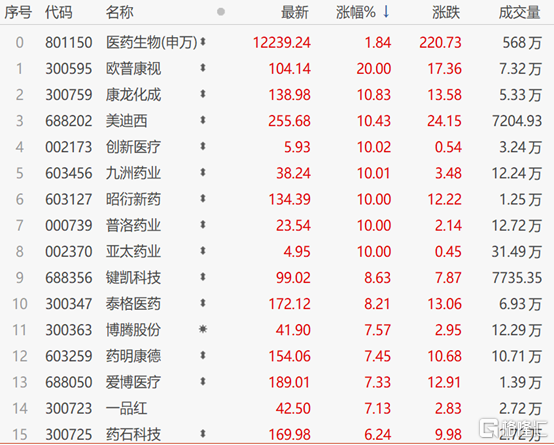
(来源:Choice数据)
CRO行业集体爆发的背后,是市场对其业绩预期向好的表现,目前已有多家CRO公司披露2020年业绩预告超预期。
昨日,昭衍新药发布2020年年度业绩预告,预计全年实现归母净利润约3.03亿元-3.22亿元之间,同比增加69.9%-80.3%;扣非后归母净利润约1.2亿元-1.387亿元,同比增加77.5%-89.6%,其中Q4单季度同比增长86.7%-106.4%,超于市场预期。
对于业绩增长的原因,一方面受政策推动影响,国内创新药市场增长高景气,2020年IND受理品种数量同比增长32%以上,公司2020年新签订单保持高速增长;另一方面,随着公司2019年中期1.08万平新动物房投产,随着公司产能释放和新签订单高速增长,规模化效应凸显。同时,昭衍新药2019年底并购美国安评机构Biomere,并表后增厚业绩。
此前,国内临床前一站式CRO细分市场龙头之一的美迪西亦公布其业绩预告,预计2020年扣非净利润为1.17-1.26亿元,同比增长100%-115%。其中Q4单季度扣非净利润同比增长235.8%。
可以看到,CRO相关公司业绩表现向好,彰显行业高景气,带动了市场对于泰格医药、康龙化学、药明康德的业绩预期上升。
除此之外,2020年新冠疫情带动生物医药研发需求快速增长,全球医疗健康产业投融资同比增长41%,国内同比增长58%,双双创历史新高,由此引发对于疫情加速全球创新药产业链转移预期提高。
从行业发展来看,随着人口老龄化不断加剧、患者医药需求日益增加,叠加医药行业刚需特性,全球医药市场保持稳定增速增长态势,华安证券预计到2020年全球医药支出将达到1.4万亿美元,比2015年增长29-32%。中国医药市场规模从2015年的12207亿元增长至2019年的16330亿元,复合增长率为7.5%,2020年有望达到17147亿元。
但在此背景下,传统药企面临着超长的研发周期、大量资金需求、低成功率等问题。全球Top10制药企业2017年研发回报率只有3.2%,第二梯队的中小型药企同年的新药研发回报率为11.9%。
因此,专注于新药研究的CRO公司孕育而生。不仅以高效赢得了大型药企的业务订单,还通过弥补小型药企研发能力不足的优势,扩大了CRO产业的服务范围,目前超过50%的制药企业都开始与CRO合作。
经过十多年的发展,CRO公司为代表的研发力量在药物设计,组合化学,高通量筛选,制剂,药动,安全性评价等平台建设进步明显,已成为新药研发的主力军。
2014年全球医药研发投入约为1416亿美元,2019年增长至1827亿美元,Frost&Sullivan预计2023年增长至2168亿美元,为CRO行业创造了巨大的发展空间。
从整体市场来看,全球CRO市场从2014年的401亿元增长至2019年的626亿美元,年复合增速为9.3%。而中国CRO市场复合增速远超全球市场,中国CRO市场由2016年的28亿美元增长至2019年的63亿美元,年复合增速为28.5%。
预计到2023年全球的CRO规模将达到877亿美元,中国的CRO市场规模将会达到172亿美元,占全球规模的约20%,年复合增速达28.54%(2019-2023年),维持在高位水平。
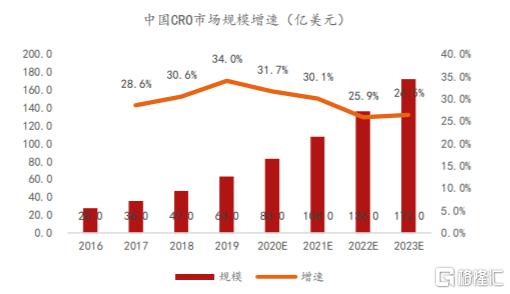
(中国CRO市场规模及预测,来源:国联证券)
不过,由于国内市场起步较晚,目前仍以仿制药为主,创新药需要的药物发现CRO市场需求较弱,整个CRO市场主要集中在临床CRO研究上,占国内市场的70%以上。目前,临床CRO的代表公司有泰格医药、药明康德、康龙化成等公司,可关注。
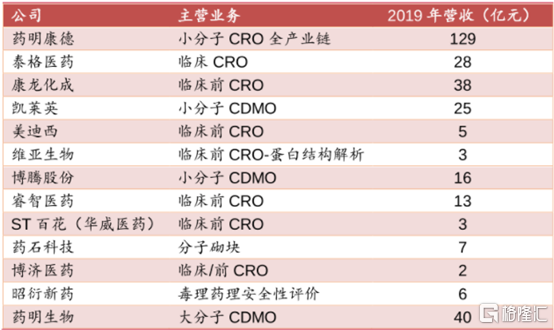
(CRO产业链上市公司盘点,来源:国联证券)
Follow us
Find us on
Facebook,
Twitter ,
Instagram, and
YouTube or frequent updates on all things investing.Have a financial topic you would like to discuss? Head over to the
uSMART Community to share your thoughts and insights about the market! Click the picture below to download and explore uSMART app!

Disclaimers
uSmart Securities Limited (“uSmart”) is based on its internal research and public third party information in preparation of this article. Although uSmart uses its best endeavours to ensure the content of this article is accurate, uSmart does not guarantee the accuracy, timeliness or completeness of the information of this article and is not responsible for any views/opinions/comments in this article. Opinions, forecasts and estimations reflect uSmart’s assessment as of the date of this article and are subject to change. uSmart has no obligation to notify you or anyone of any such changes. You must make independent analysis and judgment on any matters involved in this article. uSmart and any directors, officers, employees or agents of uSmart will not be liable for any loss or damage suffered by any person in reliance on any representation or omission in the content of this article. The content of the article is for reference only and does not constitute any offer, solicitation, recommendation, opinion or guarantee of any securities, virtual assets, financial products or instruments. Regulatory authorities may restrict the trading of virtual asset-related ETFs to only investors who meet specified requirements. Any calculations or images in the article are for illustrative purposes only.
Investment involves risks and the value and income from securities may rise or fall. Past performance is not indicative of future performance. Please carefully consider your personal risk tolerance, and consult independent professional advice if necessary.


