原油跌破這個支撐就要轉空了
本文來自格隆匯專欄:TradingView
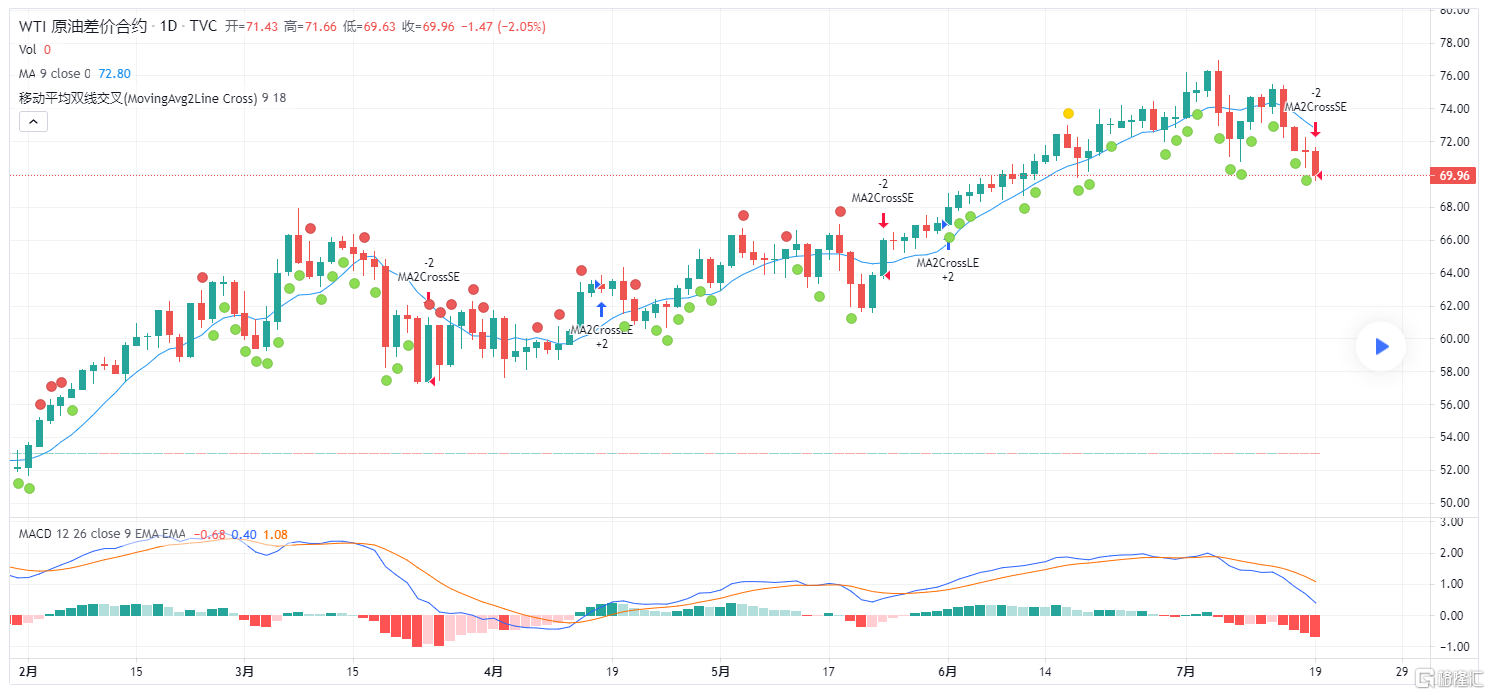
WTI原油差價合約圖表由TradingView提供
回顧昨日交易思路:在上週四給大家強調過原油目前的趨勢是下行的,多頭的機會是最後2個位置,隨後給大家71.2多,損70.7. 第二個位置是69.4多,損68.9.這是原油目前來講最後的兩個位置,雖然我長期看多但是如果此位置破了那麼我就要開啓轉頭模式了。歐佩克目前也是達成了協議要開始增產了市場目前變化莫測,消息大於技術所以我們要持續關注歐佩克的動態。
隨着沙特與阿聯酋持續兩週的爭執終於得到化解,OPEC+同意逐步向市場增加原油供應。沙特與阿聯酋達成了一項折中方案,沙特部分滿足了阿聯酋提高產量上限的要求。歐佩克代表稱,阿聯酋支持新的歐佩克+協議,該組織將每月增產40萬桶/日,去年4月達成的減產協議將延期至明年年底。計劃在2022年9月之前,在市場條件允許的情況下,全面取消580萬桶/日的減產。
根據協議,阿聯酋、伊拉克和科威特從2022年5月起將獲得更高的產量配額。歐佩克+同意阿聯酋新的原油減產基線爲350萬桶/日(仍低於阿聯酋要求的380萬桶/日)。伊拉克和科威特的產量基線分別提高15萬桶/日。
同時,歐佩克+同意從2022年5月開始,將沙特和俄羅斯的基準石油產量從之前的1100萬桶/日調整爲1150萬桶/日。總基線增幅將爲163萬桶/日。
OPEC+會議決定於今年9月1日舉行OPEC與非OPEC產油國第20次部長級會議。
那麼技術面來看原油目前到達了一個轉折點,因爲原油這波行情有點相似之前的67.944那波行情,也是在突破之前的高點之後開始向下回調,原油上次是突破2020.1.8號的高點65.62之後來到67.944開始下跌圍繞着布林帶下軌和日K的60日均線在不斷的反覆徘徊隨後開啓第二段上漲趨勢一直來到76.954.這輪是突破2018.10.3號的高點76.8之後開啓的下跌模式,而目前已經開始向日K的60日均線向下波動,所以這輪下跌的趨勢是否會繼續在日K60均線結束呢?是否是延續二次的位置?同時要注意從61.5410----76.9540的50%回調位69.2475,這就是一個雙支撐所以這個位置的關鍵不想多說了。
我只能告訴你這是你近期做多最低的一個點位,當然前提是建立在這輪和上次的趨勢是相同的走勢的情況下,所以這次做單的止損就相對來說會大一些畢竟這算是多頭新的一輪的建倉,那麼日內最高的建倉點位我認爲是69.4.止損在68.5,沒有止盈因爲我們要抓到新的一輪上漲的趨勢開始進行原油強勢做多。
本文來源:TradingView
作者:zhaojinan1
Follow us
Find us on
Facebook,
Twitter ,
Instagram, and
YouTube or frequent updates on all things investing.Have a financial topic you would like to discuss? Head over to the
uSMART Community to share your thoughts and insights about the market! Click the picture below to download and explore uSMART app!

Disclaimers
uSmart Securities Limited (“uSmart”) is based on its internal research and public third party information in preparation of this article. Although uSmart uses its best endeavours to ensure the content of this article is accurate, uSmart does not guarantee the accuracy, timeliness or completeness of the information of this article and is not responsible for any views/opinions/comments in this article. Opinions, forecasts and estimations reflect uSmart’s assessment as of the date of this article and are subject to change. uSmart has no obligation to notify you or anyone of any such changes. You must make independent analysis and judgment on any matters involved in this article. uSmart and any directors, officers, employees or agents of uSmart will not be liable for any loss or damage suffered by any person in reliance on any representation or omission in the content of this article. The content of the article is for reference only and does not constitute any offer, solicitation, recommendation, opinion or guarantee of any securities, virtual assets, financial products or instruments. Regulatory authorities may restrict the trading of virtual asset-related ETFs to only investors who meet specified requirements. Any calculations or images in the article are for illustrative purposes only.
Investment involves risks and the value and income from securities may rise or fall. Past performance is not indicative of future performance. Please carefully consider your personal risk tolerance, and consult independent professional advice if necessary.


