兴业银行(601166.SH)1H19业绩:大力夯实资产质量,核心盈利能力保持强劲
作者: 申万宏源银行组
来源:申万宏源宏观
事件:兴业银行披露2019年中报,1H19实现营业收入899亿元,同比增长22.5%;实现归母净利润359亿元,同比增长6.6%,营业收入符合预期,业绩增速低于我们的预期,2Q19不良率季度环比下降1bp至1.56%。
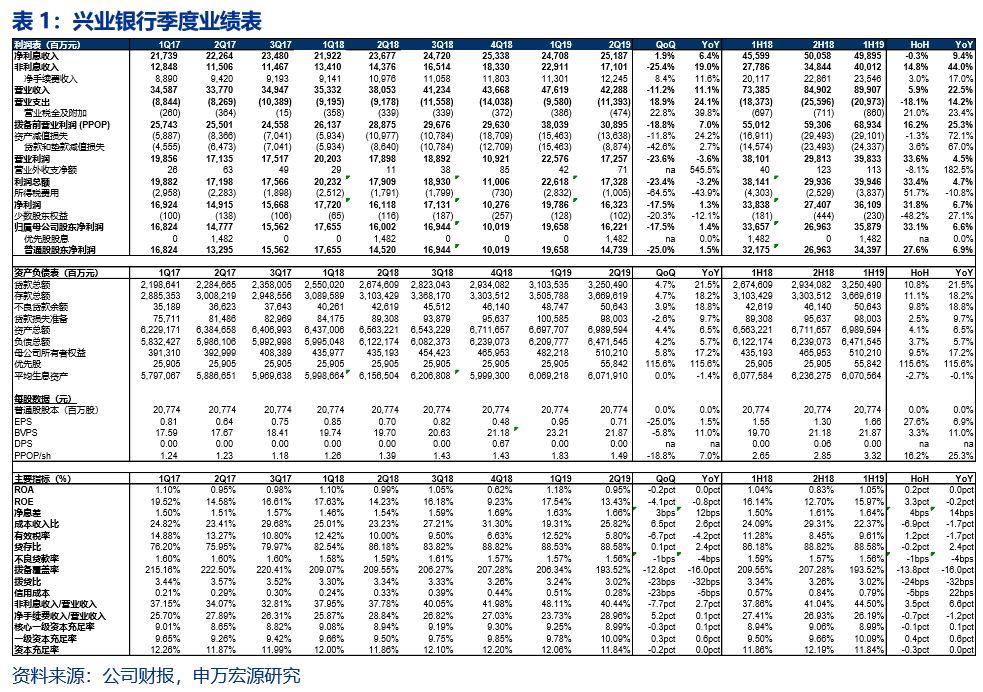
兴业银行主动提高不良认定标准、大力计提非标拨备,资产质量更加扎实。2Q19兴业银行不良率季度环比下降1bp至1.56%,2Q19加回核销不良生成率季度环比提高70bps至168bps。我们判断,二季度不良生成率的提升系不良认定趋严、一次性确认不良加大核销所致,1H19兴业银行贷款核销及转出规模为191亿(1H18为89亿)。根据业绩会上管理层介绍,截止2Q19兴业银行逾期60天以上贷款/不良降至100%以下达到93%。在不良认定标准趋严的情况下,兴业银行不良前瞻指标亦进一步向好,未来不良压力不大。
截至2Q19,兴业银行关注贷款率、逾期贷款率环比年初分别下降16bps和2bps至1.88%和2.00%。与此同时,兴业银行加大对非标资产的拨备计提力度,预计拨备覆盖更加充分。2Q19兴业银行拨备覆盖率季度环比下降13个百分点至193.5%,仍处于上市银行较高水平,根据测算其非标资产的拨贷比为2.4%,较2018年末提高62bps,实际上仅以信贷类非标资产计算该指标应更高,与表内贷款3.0%左右的拨贷比基本相当。我们认为,兴业银行拨备覆盖更加全面充分有助于缓解市场对于其非标资产不透明的长期诟病,应对其资产质量更有信心。
兴业银行营业收入、PPOP同比增速保持20%以上,“资产紧—负债松”的格局助力净息差继续走阔。1H19兴业银行营业收入及PPOP同比增速分别为22.5%和25.3%,核心盈利能力保持强劲,预计在上市银行当中处于前列。1H19兴业银行净息差(披露值)同比大幅提高22bps至2.00%,带动净利息收入同比增加9.4%。根据净息差环比变动分析,1H19兴业银行净息差继续上行的核心动力依然来自于同业负债成本下行,1H19同业负债成本环比2H18分别下降51bps至3.60%,同业负债利率因素对净息差的提升贡献14bps。再次印证我们此前的观点,市场化负债占比更高的银行,其净息差在今年“资产紧—负债松”的市场环境当中更为受益。
与行业趋势相同,1H19兴业银行对公定期存款成本开启下降趋势,环比2H18下降1bp至3.31%,由于兴业银行73%的日均存款来自对公定期,因此下半年负债端存款利率因素的负面贡献有望收窄。资产端,兴业银行进一步提高贷款占比,持续优化资产结构。2Q19兴业银行贷款占总资产的比重季度环比继续提升至46.5%,上半年新增贷款47%来自一般性对公、45%来自零售贷款,优化贷款结构帮助其1H19贷款收益率继续环比提升3bps至4.74%。
中收表现依然亮眼,银行卡及代理手续费收入同比增幅明显。1H19兴业银行手续费净收入同比增长17%,其中银行卡、代理业务手续费同比分别增长46%和39%,零售财富业务能力有所提升,上半年在代销基金、保险、信托等产品上增长较快。“商行+投行”的战略继续稳步推进,上半年兴业银行非金融企业债务融资工具承销 2412 亿元,同比增长 24%,绿色债承销42亿元,列全市场第一,资产流转 1121 亿元,同比增长147%。
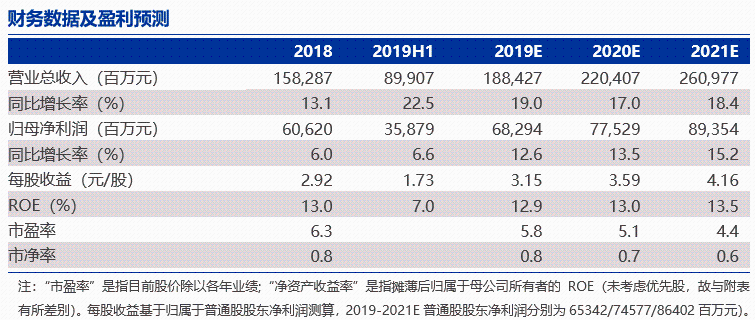
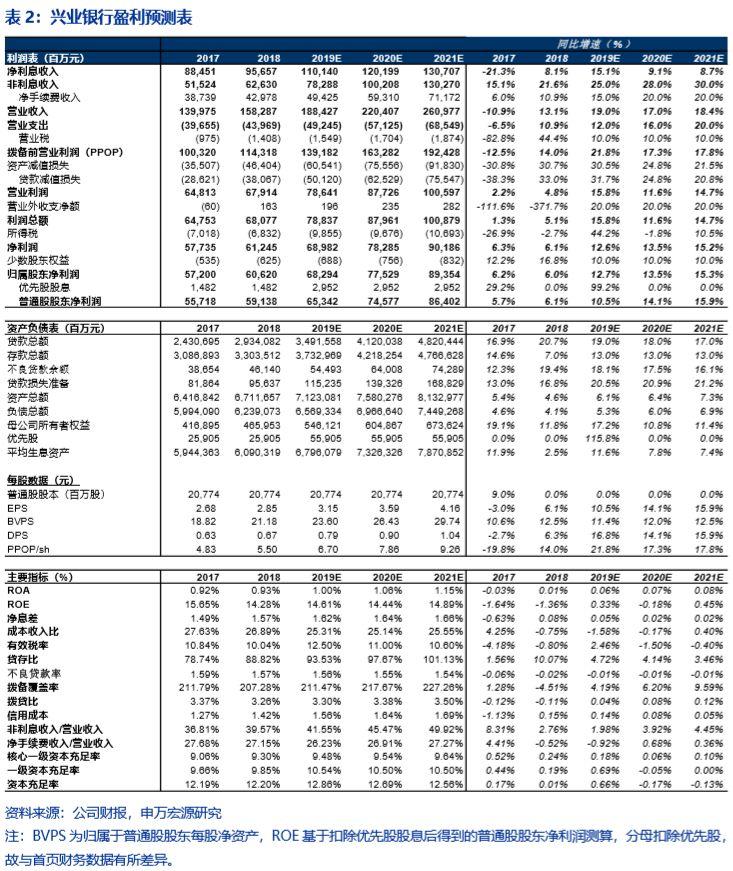
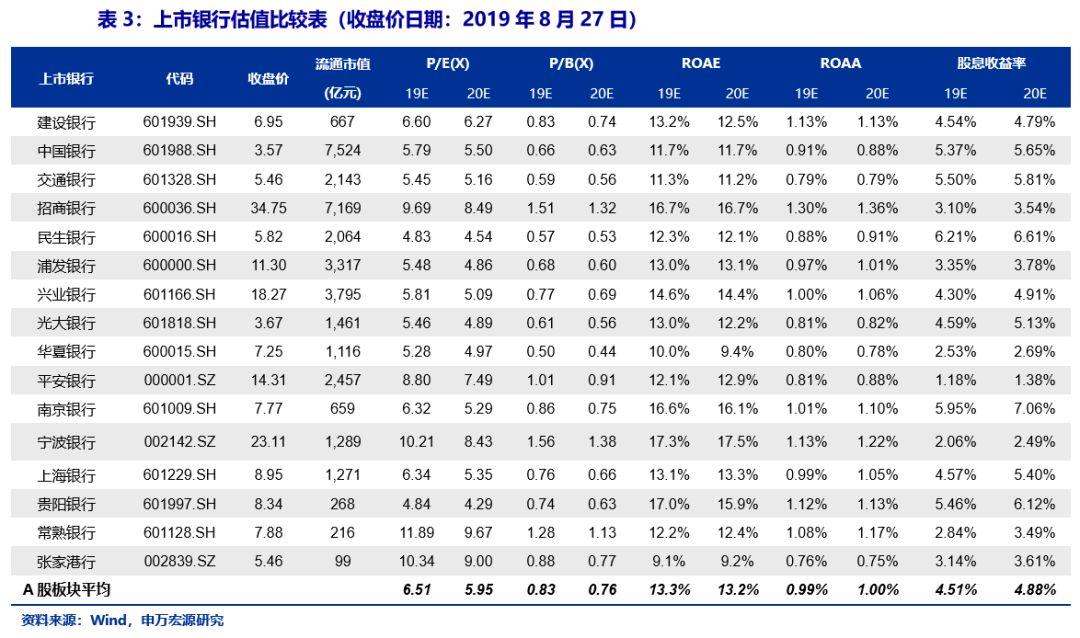
投资建议:兴业银行二季度继续大力夯实资产质量,提高不良认定标准,营收与PPOP保持20%以上的增速,核心盈利能力强劲。后续有望继续受益于“资产紧—负债松”的格局,支撑其19年下半年净息差走阔。长期战略层面,兴业银行以投行化思维多元化服务实体企业融资的发展模式有利于降低资本占用、驱动非息收入增长从而带动 ROE 持续回升,对公轻资本化赛道上跑赢同业未来可期。我们预计19-21年归母净利润分别同比增长12.7%、13.5%、15.3%(维持盈利预测)。当前股价对应19年0.77倍PB,目标估值1.2倍19年PB, 对应上行空间55%,维持买入评级,重申银行首推组合。
风险提示:经济大幅下行引发行业不良风险。
Follow us
Find us on
Facebook,
Twitter ,
Instagram, and
YouTube or frequent updates on all things investing.Have a financial topic you would like to discuss? Head over to the
uSMART Community to share your thoughts and insights about the market! Click the picture below to download and explore uSMART app!

Disclaimers
uSmart Securities Limited (“uSmart”) is based on its internal research and public third party information in preparation of this article. Although uSmart uses its best endeavours to ensure the content of this article is accurate, uSmart does not guarantee the accuracy, timeliness or completeness of the information of this article and is not responsible for any views/opinions/comments in this article. Opinions, forecasts and estimations reflect uSmart’s assessment as of the date of this article and are subject to change. uSmart has no obligation to notify you or anyone of any such changes. You must make independent analysis and judgment on any matters involved in this article. uSmart and any directors, officers, employees or agents of uSmart will not be liable for any loss or damage suffered by any person in reliance on any representation or omission in the content of this article. The content of the article is for reference only and does not constitute any offer, solicitation, recommendation, opinion or guarantee of any securities, virtual assets, financial products or instruments. Regulatory authorities may restrict the trading of virtual asset-related ETFs to only investors who meet specified requirements. Any calculations or images in the article are for illustrative purposes only.
Investment involves risks and the value and income from securities may rise or fall. Past performance is not indicative of future performance. Please carefully consider your personal risk tolerance, and consult independent professional advice if necessary.


